# 5 Minute QuickStart

歡迎加入 CoinKarma，CoinKarma 是專業 Crypto 交易員與機構信賴的指標平台，提供多樣化的洞察性交易指標，協助您在交易中依據數據做出高效且理性的決策。

## 🔈 Limited Channel｜加入會員專屬頻道 掌握各式快訊

{% hint style="info" %}
以下頻道，為付費會員專屬限定，於[此頁面](https://www.coinkarma.co/account)完成帳號綁定後，點擊導覽列  「 Telegram 機器人 」 即可加入。
{% endhint %}

* 📢 **Token Screener 山寨幣篩選器：於會員專屬頻道每小時播報，快速篩選出強勢幣種與弱勢幣種。**（詳細解說參考 [Token Screener](https://docs.coinkarma.co/features-guide/token-screener) 頁面）

<figure><img src="/files/mr0dxYAZ8rWGmQ10KfCB" alt=""><figcaption></figcaption></figure>

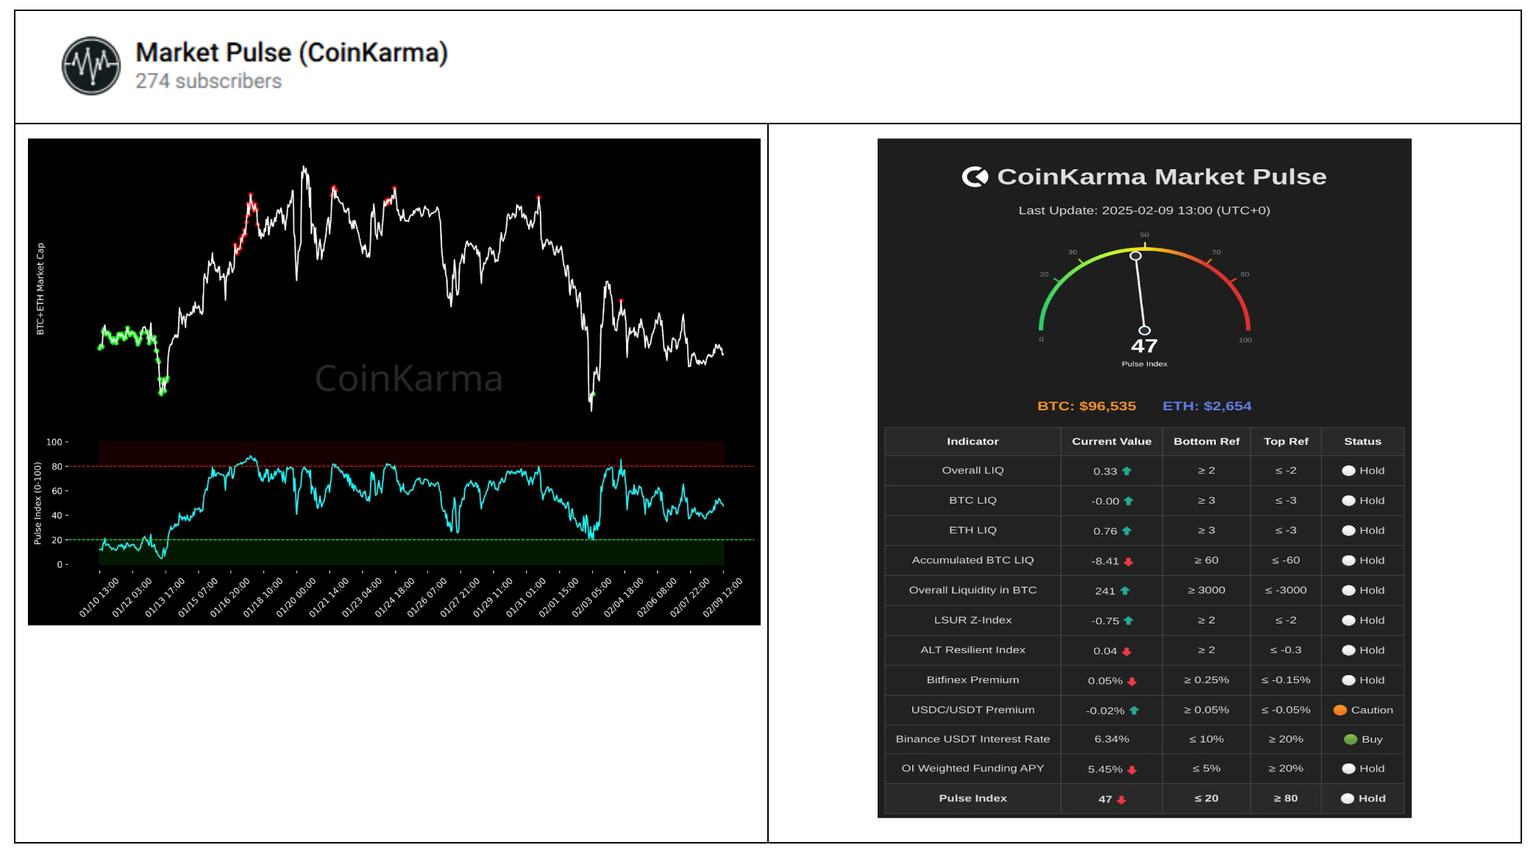
* 📢 **Market Pulse: 綜合指標指數，可即時觀測市場綜合狀況，把握行情反轉機會。**（詳細解說參考 [Market Pulse](https://docs.coinkarma.co/features-guide/market-pulse) 頁面）

<figure><img src="/files/23m3aTbVtLrk0347YwzU" alt=""><figcaption></figcaption></figure>

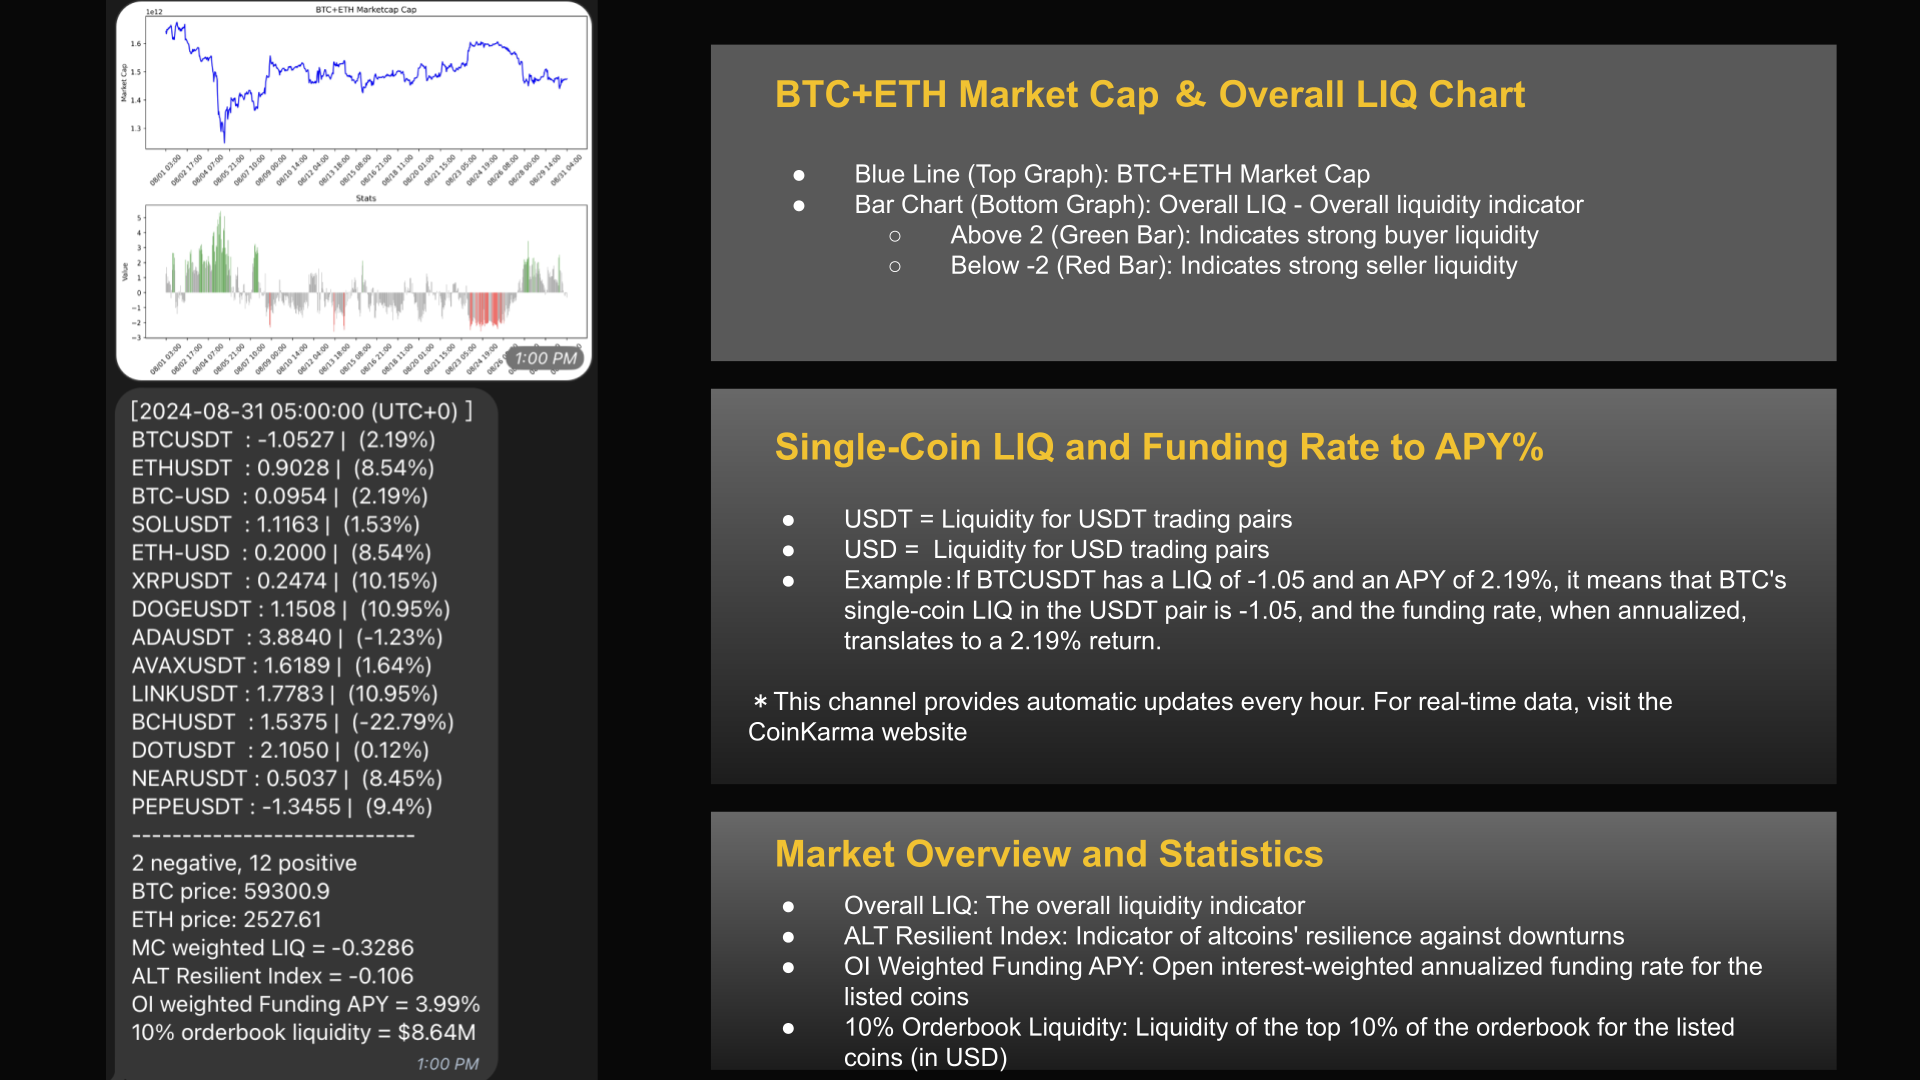
* 📢 **Overall Liquidity Alert**: 每小時播報，整合 BTC + ETH 的市值狀況與各幣種 LIQ 的狀態，以及市值加權 Overall LIQ 的實時數據。（詳細解說參考 [LIQ](https://docs.coinkarma.co/indicators-guide/liq) 頁面）

  <figure><img src="/files/RmIYHf7g47DCrlc8UhEq" alt=""><figcaption><p>Overall LIQ 頻道參數說明</p></figcaption></figure>
* 📢 **Grid Trading Signal**: 會員專屬 OKX 網格策略信號，根據 Overall LIQ 與幣種相對強弱指標，提供ㄧ鍵開單。（詳細解說參考 [Grid Trading Signal ](https://docs.coinkarma.co/features-guide/grid-trading-signal)頁面）

<figure><img src="/files/4Zxy4unQtq1GRZ7QKVGG" alt=""><figcaption></figcaption></figure>

## 📋 Dashboard Overview｜指標看板使用教學

{% hint style="info" %}
註冊登入後，進入 CoinKarma 的 [Chart Dashboard](https://www.coinkarma.co/chart)，即可觀測即時指標狀態並復盤歷史數據，以下是常見操作的快速指南：
{% endhint %}

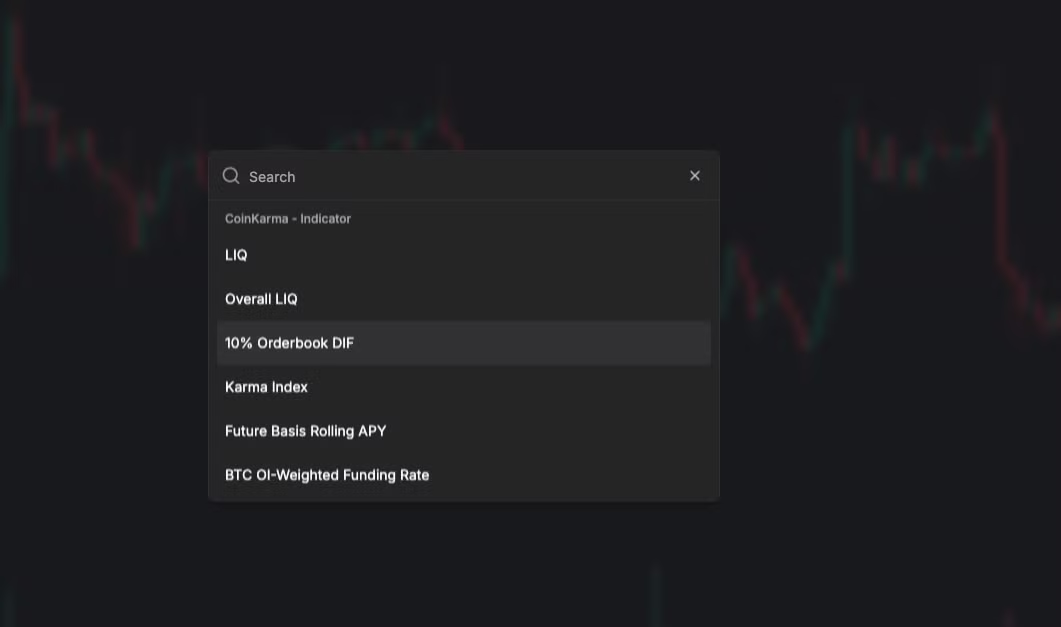
* **新增 CoinKarma 指標**：點擊 CoinKarma Indicator，選擇需要的指標項目（可選擇多個）

<figure><img src="/files/MtZvf0CfvJiNCtCjrhds" alt=""><figcaption></figcaption></figure>

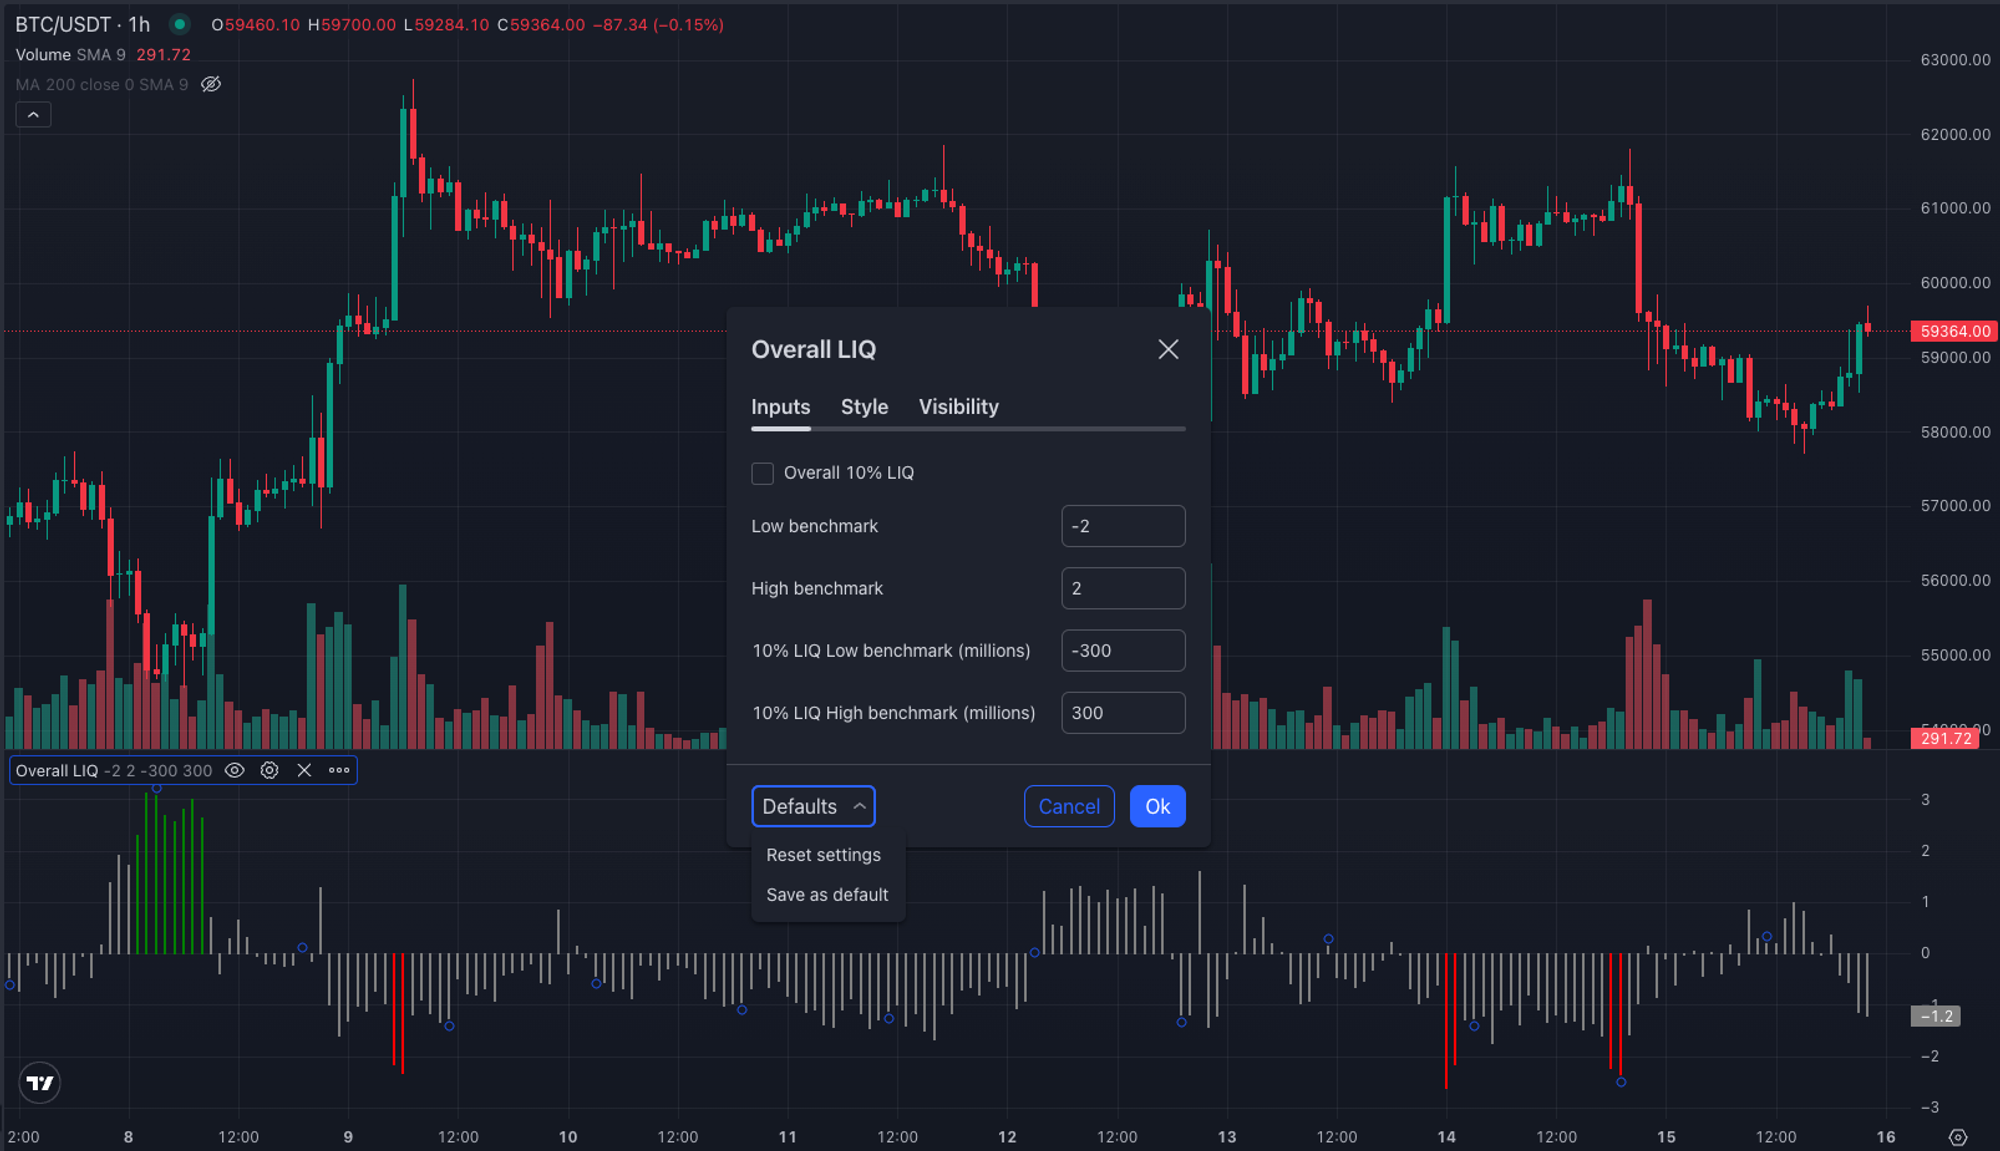
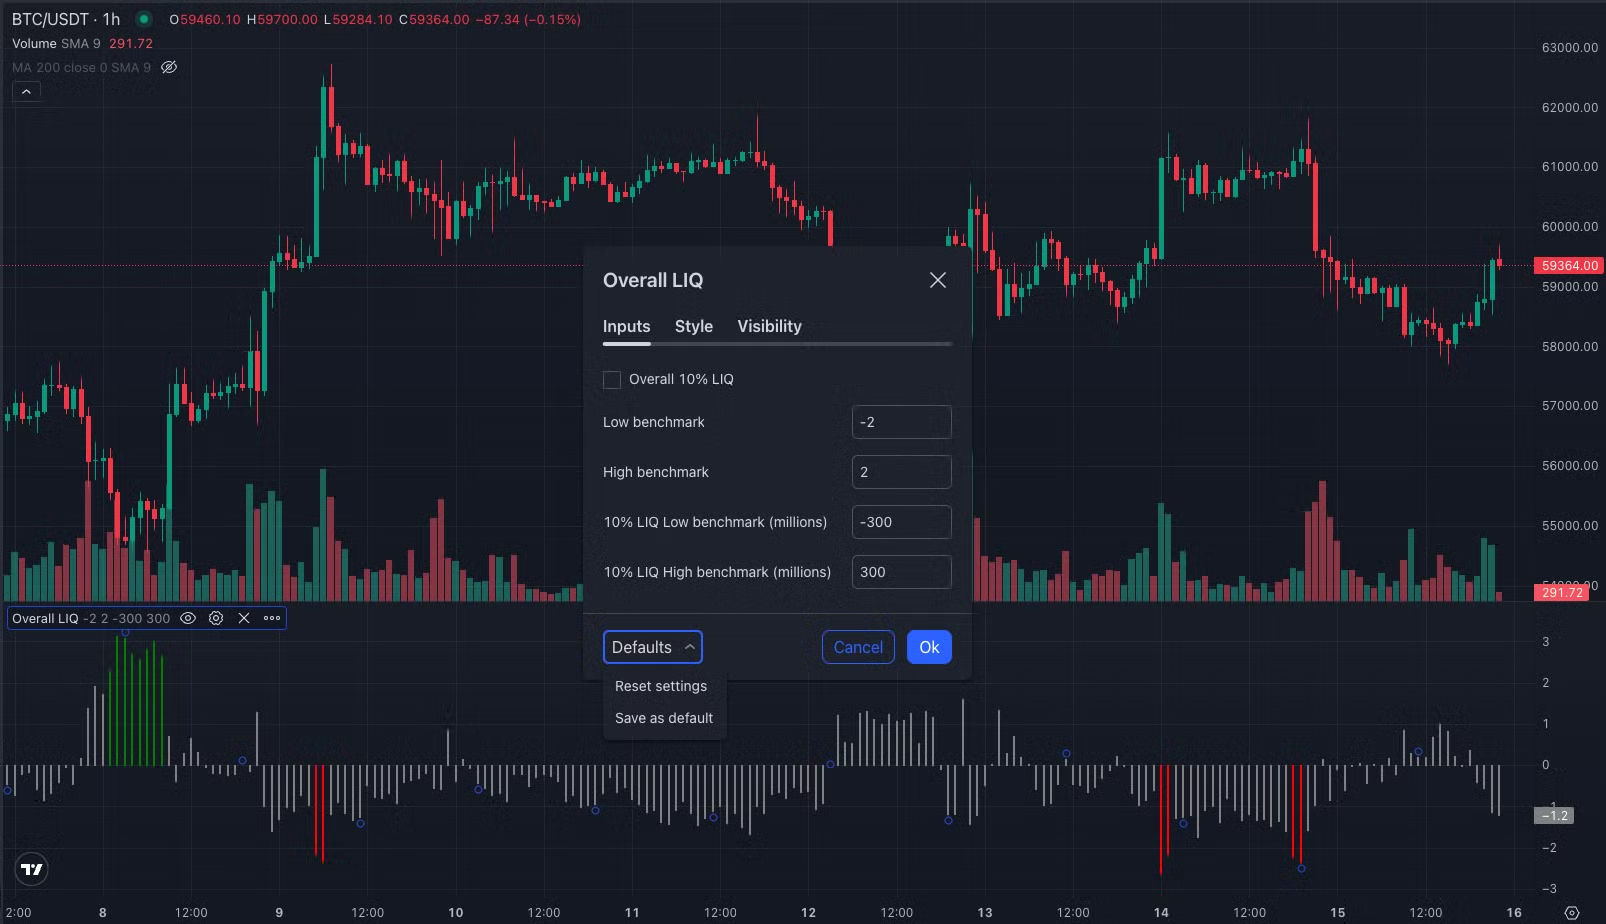
* **調整參數 Benchmark**：滑鼠移至左下角指標名稱，點擊齒輪 icon，可調整參數值；點擊「Defaults」即可恢復預設值。

<figure><img src="/files/Xd0LNnqwLTfRwtWP4yKN" alt=""><figcaption></figcaption></figure>

## 🎯 Indicators Tips｜快速上手重點指標

* **精選指標概覽**

<figure><img src="/files/k9Te9GGwDlDYPPdjZFKc" alt=""><figcaption></figcaption></figure>

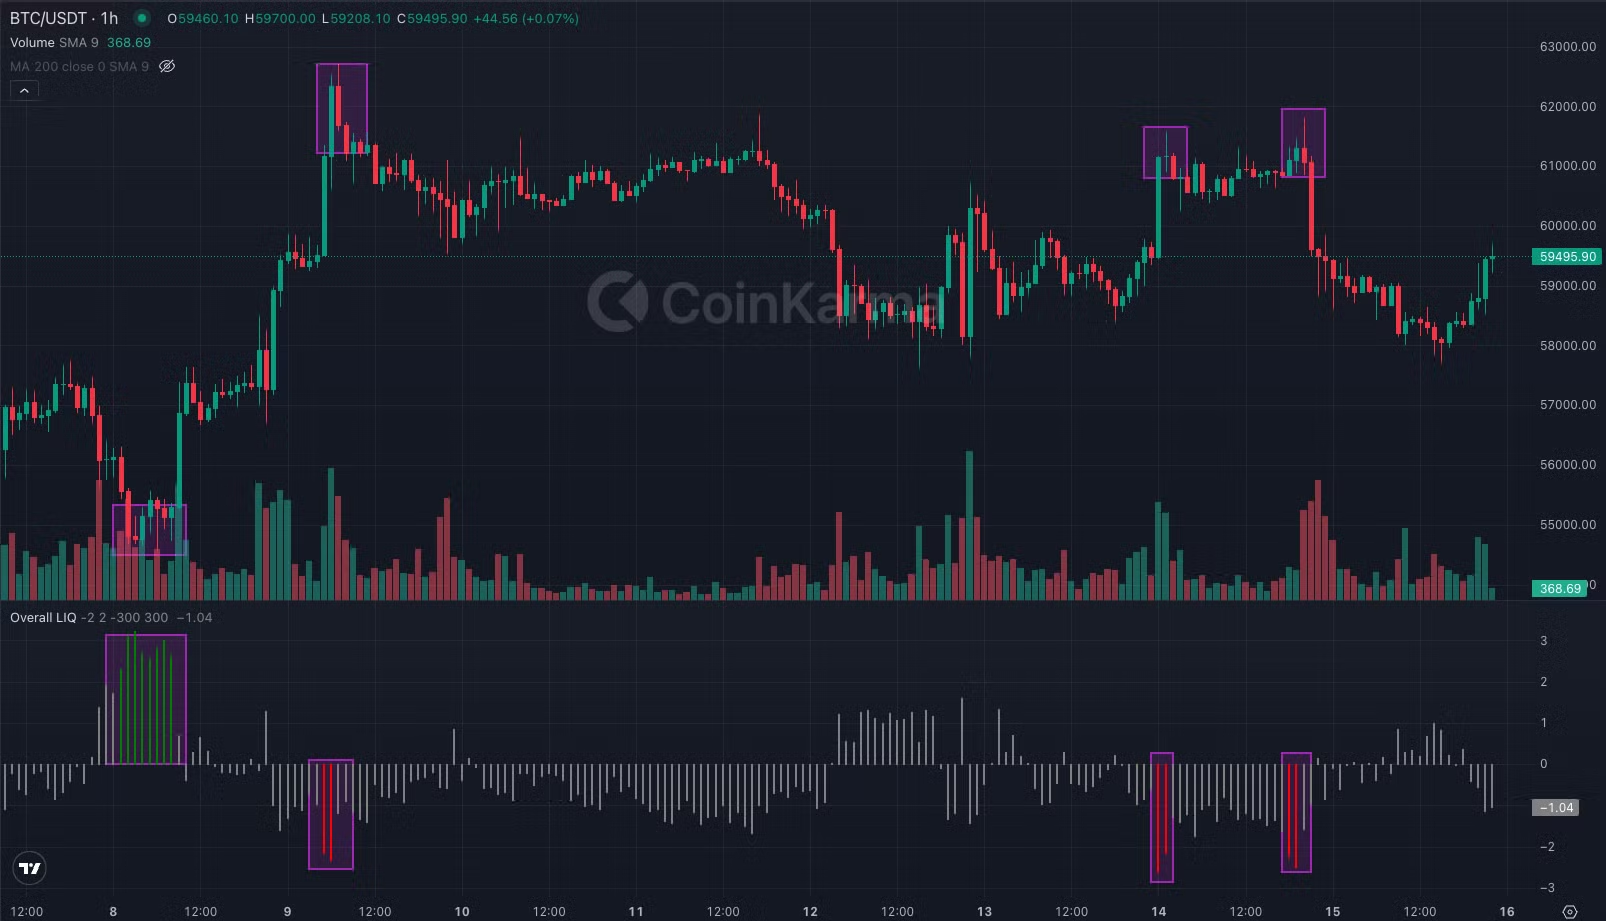
* **Overall LIQ**
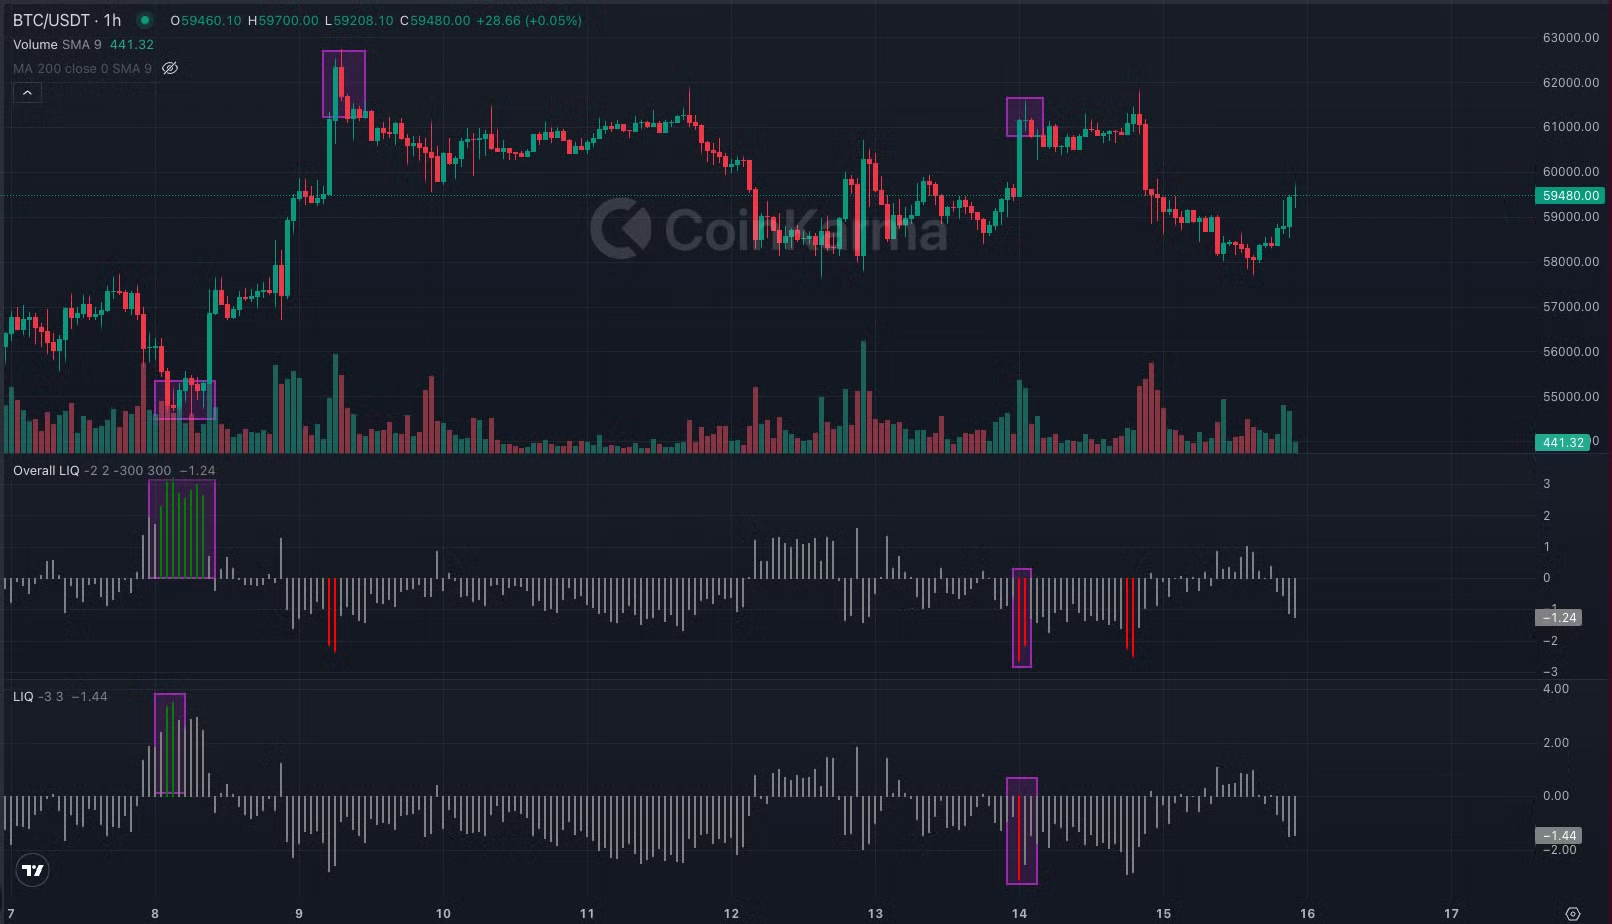
  * 市值加權流動性指標，用於判斷市場整體流動性狀態。預設基準值為(2, -2)，低於-2 顯示紅柱，超過 2 顯示綠柱。建議與 CVD、Funding Rate、ARI 等指標綜合判斷。

<figure><img src="/files/jJN093pjAL4pwHLdZk4w" alt=""><figcaption></figcaption></figure>

* **LIQ**
  * 單幣別流動性指標，輔助判斷個別幣種的流動性狀態。預設基準值為(3, -3)，低於-3 顯示紅柱，超過 3 顯示綠柱。不同幣種的 Benchmark 可自行調整，並與 Overall LIQ 及其他指標搭配使用。

<figure><img src="/files/OeSpHOcpDmeR1ZLczeyT" alt=""><figcaption></figcaption></figure>

* **ALT Resilient Index**
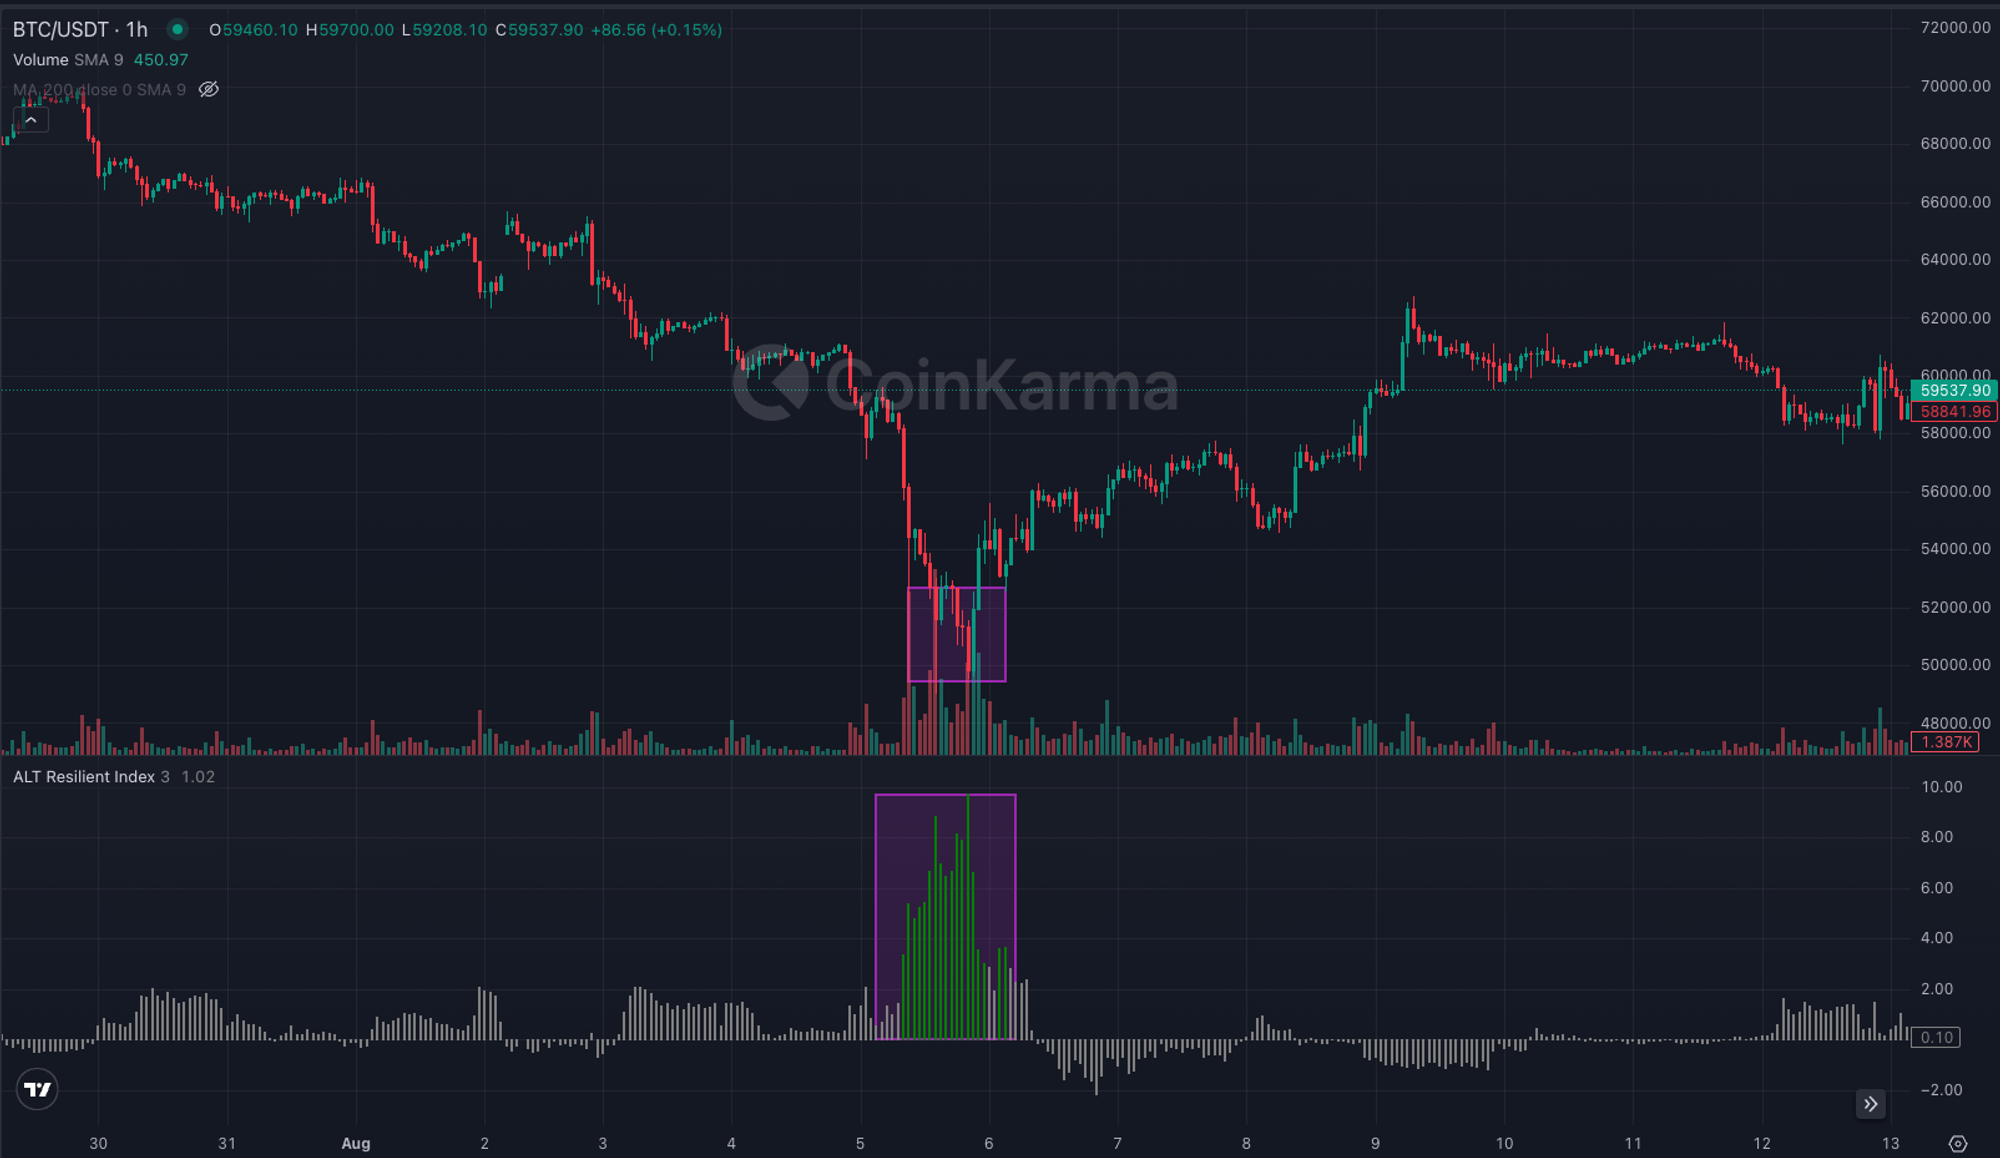
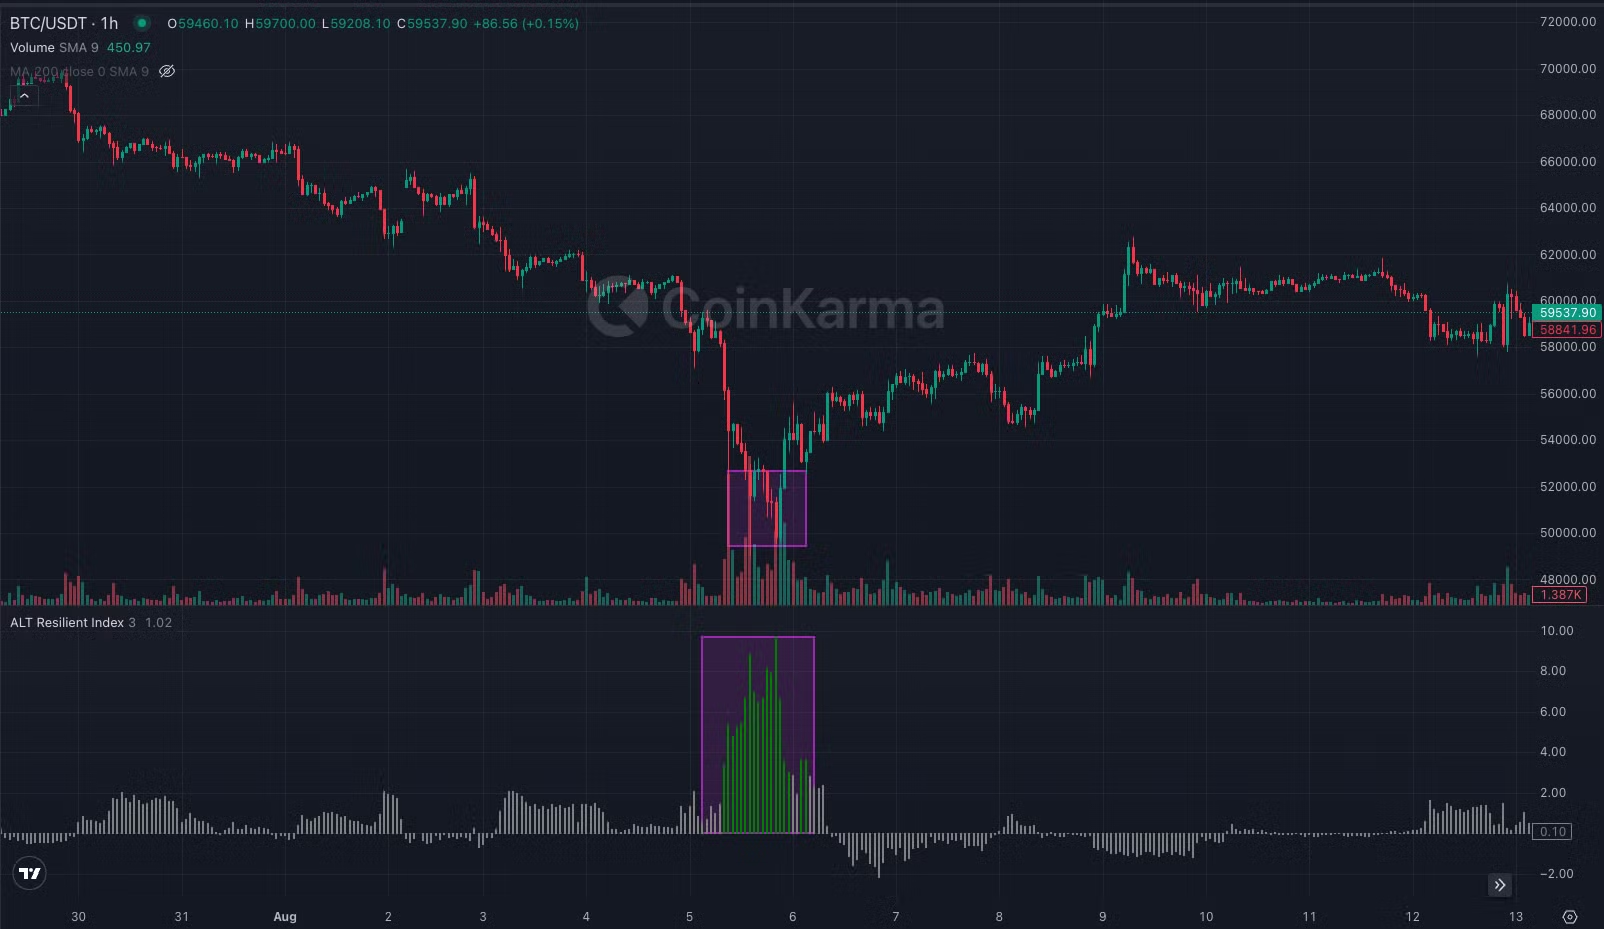
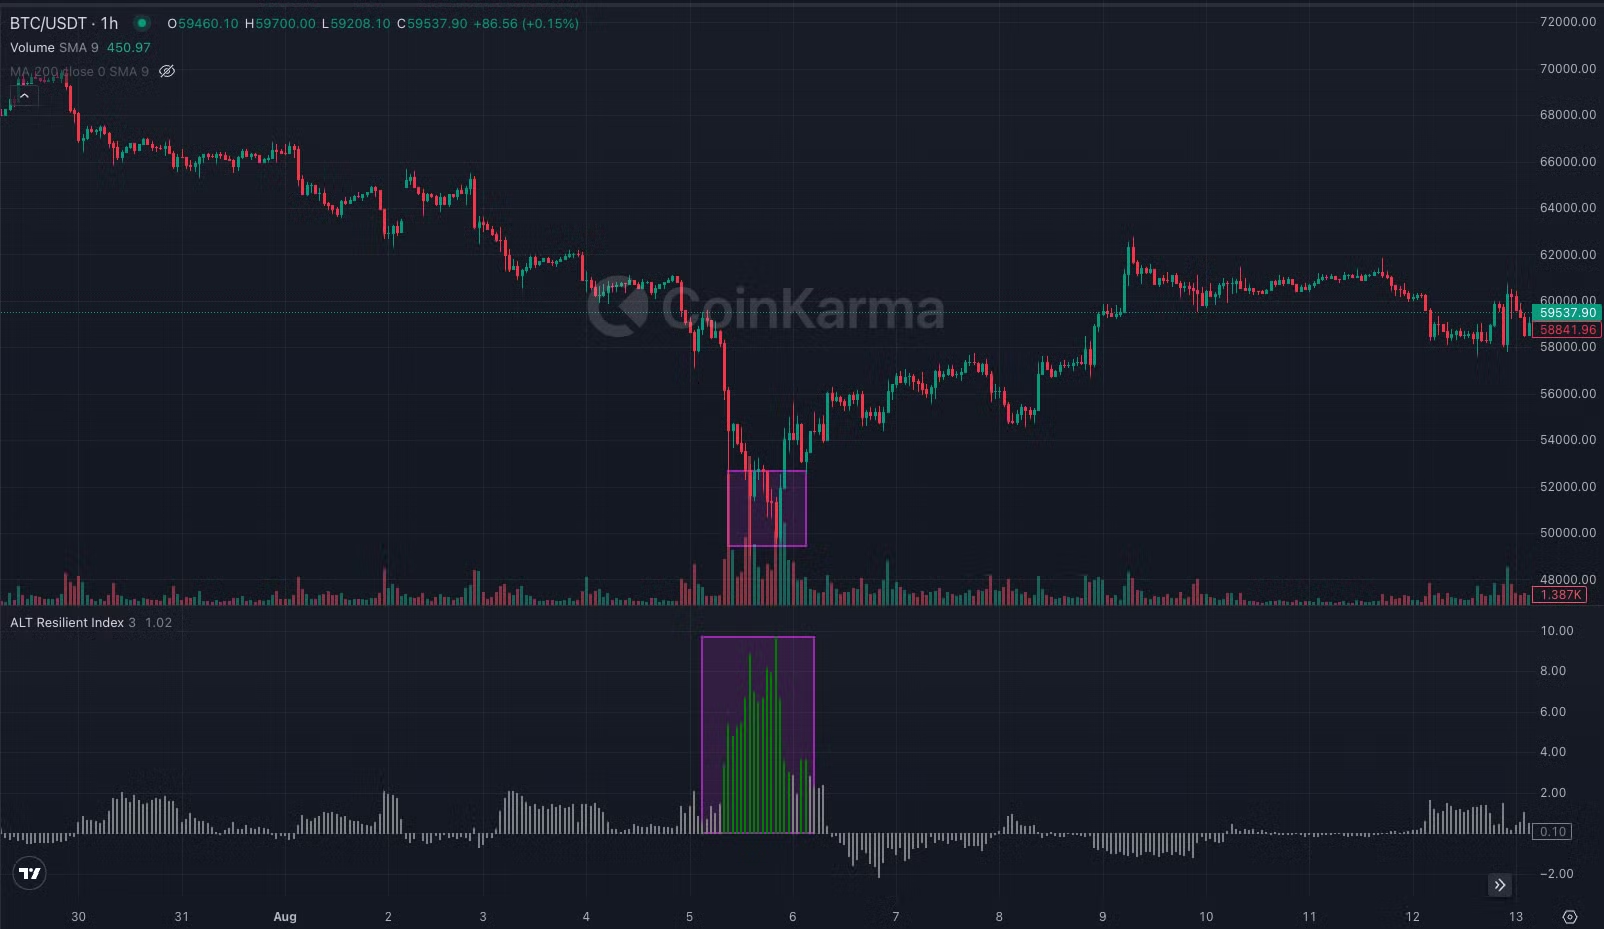
  * Altcoins 抗跌指標，用於判斷在市場下跌趨勢中，Altcoins 相對於 BTC 的抗跌能力，數值越高，代表其在下跌中的強勢程度，適合用於判斷市場階段性低點。

<figure><img src="/files/B9dBFnl7v4ItI9KWq5p4" alt=""><figcaption></figcaption></figure>

* **Accumulated Overall LIQ**

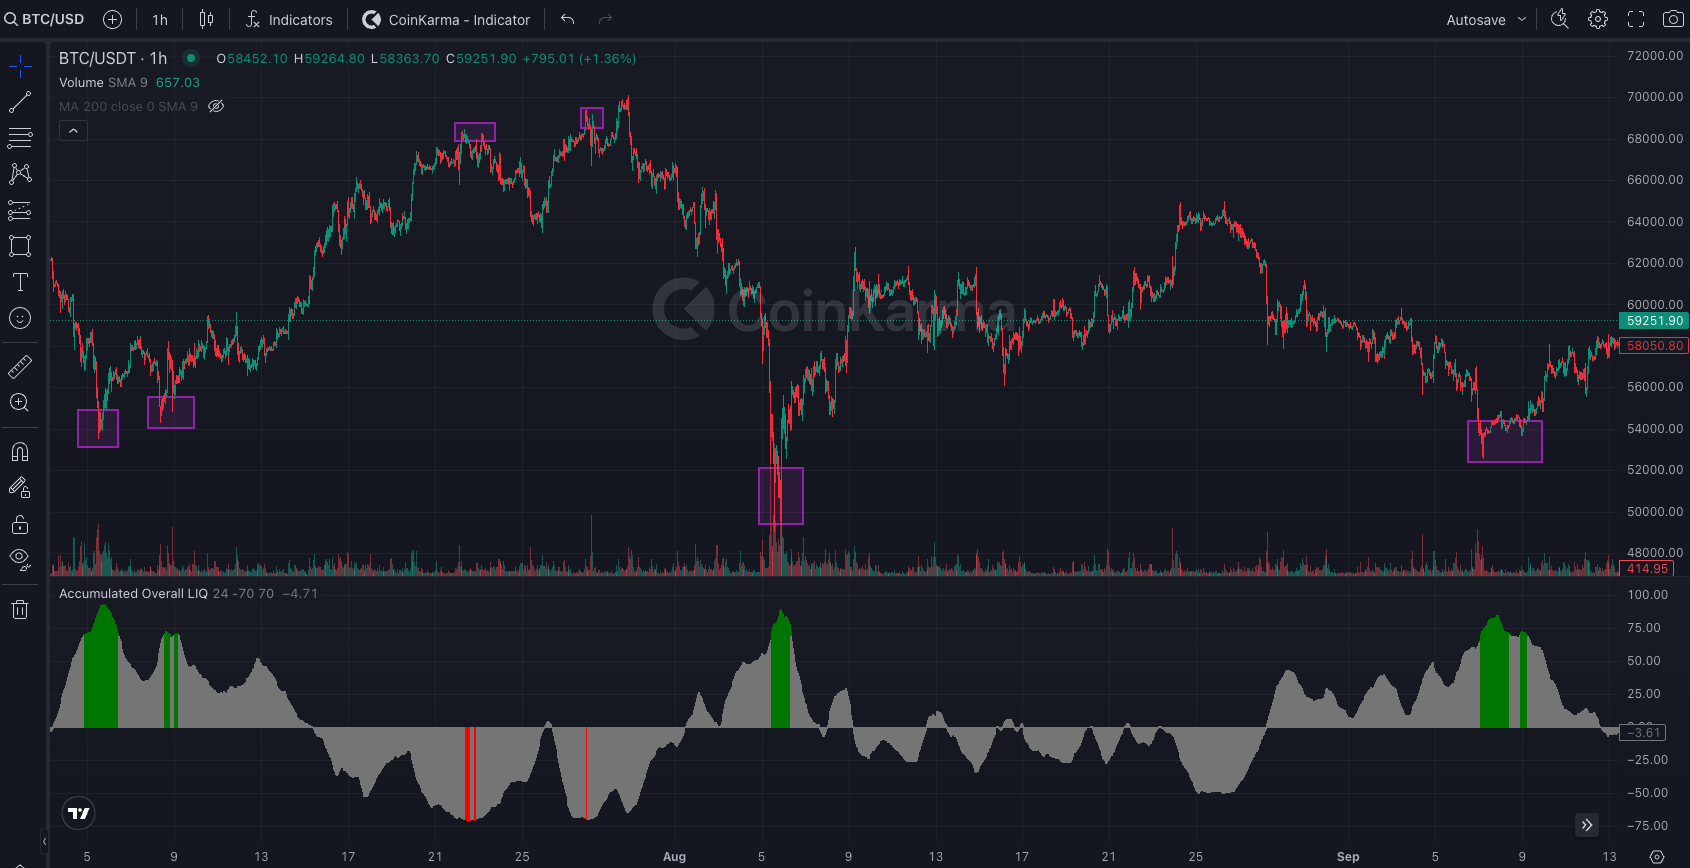
  * 為 Overall LIQ 的累積加總指標，可自行透過覆盤調整參數，預設值為（24, 70, -70），用於觀測過去 24 小時內 Overall LIQ 的數值加總，當超過 70 顯示綠柱，小於 -70 則為紅柱警示，適合搭配 Overall LIQ, ARI 等不同指尋找市場相對高低點的交易機會。

  <figure><img src="/files/9X1pbaT3uTAKW1oCJcjg" alt=""><figcaption></figcaption></figure>

### 🤝 Referral & Affiliates｜邀請好友與聯盟推廣

{% hint style="info" %}
登入 CoinKarma 後，點擊右上方個人頭像，進入「[Referral](https://www.coinkarma.co/account/referral)」頁面，獲取專屬邀請連結，邀請好友加入 CoinKarma，您與好友均可獲得 CoinKarma Points，可用於使用期間的兌換延長。
{% endhint %}

若您是 KOL 或是擁社群資源，您的受邀獎勵將可直接兌換成美元現金，歡迎申請加入我們的 Affiliates Program ▶️  [申請表單（點我加入）](https://forms.gle/DXkodkvXrYhU6yiP8)

### ℹ️ Support｜聯繫客服與瞭解更多

* Coinkarma blog： <https://blog.coinkarma.co/>
* 其他客服問題： <https://t.me/CoinKarma_Roman>


# FAQs

歡迎加入 CoinKarma，邀請您透過以下資訊，快速瞭解相關指標與工具，若有其他問題，可先查閱下方「常見問題 FAQs」，若仍無法解決您的問題，可至 Telegram「新手提問區 Newbie」進行發問。

**如何加入 Telegram 群組？**

* 請先於官網[帳戶頁](https://www.coinkarma.co/zh-tw/account)完成 Telegram 帳號綁定（特別注意：若未先於官網完成綁定就點擊加入群組，系統將自動鎖定帳號。若發生此狀況，請聯繫[客服](https://t.me/CoinKarma_Roman)協助處理）
* 完成綁定後，返回首頁點擊 「Telegram 」 即可加入。

若有帳戶相關問題，可以直接聯繫官方客服： 👉 <https://t.me/CoinKarma_Roman>

### 產品功能

* **使用 CoinKarma 推薦碼註冊 OKX 有什麼好處？**&#x20;
  * 訂閱 CK 時享 10% 折扣。
  * 在 OKX 的交易量可賺取點數折抵訂閱天數。
  * 額外享有 OKX 端的 10% 手續費減免。
* **CoinKarma 網頁出現錯誤、指標數據未更新或顯示不全怎麼辦？**
  * 這通常是瀏覽器快取或網路問題造成的。請嘗試：
    1. 按住 Ctrl + Shift + R (Mac: Cmd + Shift + R) 強制重新整理並清除快取。
    2. 重新登入帳號。&#x20;
    3. 關機重啟。
  * 若仍有 "Failed to load" 錯誤，請稍後重試或聯絡客服。
* **CoinKarma 在 OKX 上有哪兩種跟隨方式？分潤結算機制有什麼不同？**
  * CoinKarma 目前在 OKX 提供兩種模式，兩者的結算制度彼此獨立：
    * 1\. DCA 馬丁交易信號：採 OKX 跟單制度與週結制。同一結算週內的盈利與虧損可以互相抵扣，但不同週之間的虧損不會延續至下一週。
    * 2\. Ultron Signal：採 OKX Signal 制度與月結制，每月 1 日統一結算，依當月已平倉訂單的總收益計算分潤。跨月虧損不會延續，且不採用高水位線（HWM）機制。
* **請問要如何讓我的圖表出現紅色與綠色的買進賣出箭頭？**
  * 在指標中選取「custom-signal」可自定義出現箭頭的條件，請參考：[Custom Signal 詳細說明頁](https://docs.coinkarma.co/features-guide/custom-signal)
* **請問目前 CoinKarma 有 API 服務嗎？**
  * &#x20;目前尚未提供 API 服務。
* **指標只能用 CoinKarma 網頁看嗎？能加載到 TradingView 嗎？**
  * 是的，CoinKarma 的獨家指標只能在官網圖表查看，無法加載到 TradingView 使用。
* **我是新用戶（Gold 年會員 14 天試用期），為何無法關聯 OKX 或使用策略機器人？**&#x20;
  * Ultron 跟單與策略機器人功能僅開放給正式付費會員，試用期內無法使用。若希望立即使用，可選擇跳過試用期直接付款。
* **為什麼在「方案」頁面找不到 USDT 內轉或切換支付方式的界面？**&#x20;
  * 目前續費邏輯需與原支付方式一致（Stripe 信用卡續費需用 Stripe）。暫不支持自助切換（如 USDT 轉信用卡）。如有特殊需求，請聯繫客服手動處理。
* **Custom Signal 客制化信號警報是不是只能在每個小時的結束才會被觸發 (Trigger)？**&#x20;
  * 是的，系統會在每小時收線 (Close) 時檢測，若符合條件才會發送警報。
* **客製化訊號可以設定多個指標「同時達標」才觸發 Alerts 嗎？**
  * 可以。在客製化訊號設定中，點選「添加條件」即可設定多個指標共振觸發。只有當所有設定條件同時滿足時，系統才會發送 Alert。
* **Custom alerts 的推播時間顯示好像慢了一個小時？**
  * 這是因為 3 點收線的指標，系統會在 4 點發送。團隊目前正在調整發送時間的顯示方式，以免造成誤會。
* **Custom Signal 可以自己更改名稱嗎？**
  * 目前無法自定義名稱，但在圖表顯示上，建議可以使用不同「顏色」或「圖形」來區分不同的 Custom Signal。
* **選幣工具 (Token Screener) 裡面的幣種範圍是固定的嗎？**&#x20;
  * 目前支援 40+ 主流幣種，涵蓋市場主要熱點。

### Ultron Signal

* **如何訂閱 Ultron Signal？**
  * 請先確認您為正式 Gold 方案會員（非 trial 會員身份），確認後前往[ Ultron Signal ](https://www.coinkarma.co/zh-tw/ultron-signal)頁面，點擊右上角「訂閱」 即可。
* **Ultron Signal 跟單金額門檻是多少？**
  * 槓桿後資金超過 $1000 美元即可。
* **Ultron Signal 支援哪些平台？Hyperliquid (HL) 版本有什麼不同？**
  * &#x20;目前支援 OKX 與 Hyperliquid (HL)。
    * OKX: 中心化交易所，適合大多數用戶。
    * Hyperliquid: 鏈上衍生品交易所，適合受地區限制無法使用 OKX 的用戶。
    * 差異: 兩者績效長期來看相近，主要差異在於手續費與資金費率。
* **Ultron 在 Hyperliquid 上有加倉，但 OKX 沒有，它們的加減倉是ㄧ至的嗎？**
  * 兩邊會因為手續費跟資金費率而有些微差異，長期跑下來結果不會差太多。
* **OKX 上想追加資金的話，可以直接在已運行的策略裡增加保證金嗎？**
  * 可以。操作： 選擇調整保證金，增加時務必勾選 「增加的保證金計入已投入保證金」，這樣新增資金才會納入策略開倉計算。
* **Binance 上有辦法接 Ultron Signal 嗎？**
  * 目前支援 TradingView 以外 Webhook 信號源的交易所只有 OKX。其他交易所僅支援 TradingView 作為 server 地址發送信號，因此目前無法支援 Binance 直接接入 Ultron Signal。
* **請問 Ultron 策略一個帳戶可以多開嗎？例如 3 倍開一個，5 倍也開一個機器人？**
  * 可以。
* **有沒有辦法複製 Ultron 策略但使用自己的高槓桿方案（如 20 倍）？**
  * 可以另開一個 Bot 使用高槓桿跟隨，但風險极高。高槓桿在策略回撤期容易直接爆倉（如開 20 倍槓桿，從平均持倉價格跌 5%即爆仓）不建議長期持有。
* **Ultron 策略如果開 5 倍槓桿，實際跟單也是 5 倍嗎？**
  * 正常情況下會依照設定的槓桿跟單。但如果系統觸發 Long Filter 第一層保護機制，多單部位會被砍半，因此即使設定 5 倍，實際最高也可能只開到約 2.5 倍。
* **請問 OKX 上的 Ultron Signal 策略，創建後還能修改倍數嗎？**
  * 創建後不能修改槓桿倍數，需取消跟單後重新創建。
* **Ultron Signal 跟單的分潤 (10%) 是怎麼計算的？**
  * OKX 版本的 Ultron Signal 採月結制，每月 1 日統一結算。分潤依當月內已平倉訂單的總收益計算；浮盈但尚未平倉的部位不列入當月分潤。不同月份各自獨立，跨月虧損不會延續至下月抵扣，且不採用高水位線（High-Water Mark, HWM）機制。
* **連結了 Ultron Signal 信號，中途可以提取資金嗎？**
  * 可以隨時提取，但不建議在未平倉時提取。這會導致保證金減少，增加持倉風險。
* **Ultron Signal 目前有支援其他幣種嗎？**
  * 目前官方信號 Ultron Signal 只做 BTC，如有其他幣種的量化需求，可自行透過[自動化交易機器人](https://www.coinkarma.co/zh-tw/strategy-builder/my-strategy)建置。
* **Ultron Signal 目前的開關倉判斷邏輯是什麼？**
  * 主要透過 Multi-Layer Dynamic 動態調整，並非固定閾值。策略核心多為均值回歸 (Reversion)。
* **Ultron Siganl 會有價格止損嗎？如何止損？**
  * Ultron Signal 並未設定固定的止損線，主要原因是每位用戶使用的槓桿倍數不同，若採用統一止損線，容易導致高槓桿過晚止損、低槓桿又過早離場，而策略本身已具備動態風控邏輯，當市場出現過度延伸（Overextend）時，Ultron 會在反彈階段自動減倉或出場，形成「自然止損」效果。
* **請問原本有在 OKX 跟 Ultron 的，會建議轉移到新上線的 Hyperliquid 嗎？**
  * &#x20;不建議頻繁轉移。兩邊績效差不多，HL 主要是提供給無法使用 OKX 的會員。
* **為什麼 Hyperliquid 不能存錢了 (Deposit causes leader share to drop below 5%)？**
  * 這是因為 HL 的 Vault 規定帶單人 (Leader) 必須佔有總資金的 5% 以上。如果跟單資金過多導致比例下降，系統會暫停存款。需等待官方調整額度。
* **現在接入 Ultron 信號，會直接拷貝當前的倉位比例嗎？**
  * &#x20;不會。新接入 Ultron Signal 時，不會直接複製當前倉位比例，而是等待後續新信號再進場。
  * 若前面已經有開倉或加倉信號，您中途接入後會先保持空手；後續若有加倉信號，會從 0 開始跟隨。一般不建議手動補倉，因為策略中途可能已經做過多次加減倉或波段操作，手動介入容易導致成本不同步。等到下一輪完整開倉週期後，倉位會逐漸同步。
* **收到離場信號但下單失敗，顯示「倉位不存在」是什麼意思？**
  * 這通常代表您在前面的開倉或加倉信號時並沒有成功跟上車。Ultron 的信號是根據 MPI 變化判斷加減碼，如果錯過了先前的建倉或加碼信號，後續策略觸發減碼時，帳戶內沒有對應倉位，就會出現「倉位不存在」的提示。
  * 不用過度擔心，跟隨時間拉長後，後續加減倉信號會讓帳戶淨值曲線慢慢同步。
* **Ultron Signal 會有複利效果嗎？**
  * 會的。每次開倉數量會根據帳戶淨值計算，若獲利增加，下次開倉數量也會相應增加。
* **已經有 OKX 帳號但沒有綁定 CoinKarma 推薦碼，還可以建立策略機器人嗎？**
  * 可以。舊 OKX 帳號即使沒有綁定 CoinKarma 推薦碼，也可以正常建立與運行策略機器人，不影響跟單功能。不過，綁定 CoinKarma 推薦碼可享有交易量累積點數、訂閱折抵與 OKX 端手續費減免等福利。
* **隨著 Ultron 訂閱人數與資金量增加，投資的回報比例會減少嗎？**
  * 不會。從你跟單開始，Ultron 績效是多少你就是多少，與目前訂閱總人數/總資金無關。
* **今天試著將 HL 中 Ultron 的獲利提出，中間短少了 1.15%，這是在分潤的 10% 中嗎？**
  * HL 的金庫只能抽 10%，這是寫死的，協議也沒有額外抽費用。短少可能源於 滑點 或 Gas 估算，非額外收費。
* **如果一開始 Ultron 開倉多單，帳戶全倉建倉，下一個信號是加碼，會因為沒資金而不執行嗎？**
  * 倉位打滿很難發生。Ultron 是每小時按動態值 (MPI) 自動調倉，很少會長時間佔用 100% 資金。
* **Ultron 在均線附近頻繁調整槓桿，這是系統異常嗎？**
  * 這是刻意設計的風控機制，不是系統異常。當 BTC 價格越過均線或均線斜率改變時，系統會即時調整槓桿，以快速降低潛在回撤。均線附近反覆震盪時可能產生少量交易摩損，但若設定較長延遲，真正出現急跌時可能反應過慢，承受更大的回撤。
* **關閉 Ultron 跟單策略後立即重新開啟，前一週期的虧損會抵扣後續分潤嗎？**
  * 不會。停止後重新開啟會視為新的跟單週期，前一週期的虧損不會轉入新週期抵扣。OKX 版本 Ultron 採月結制，分潤依當月已平倉訂單的總收益計算；跨月虧損不會延續至下一個月，也不採用高水位線機制。
* **在 OKX 跟單策略中，零持倉時為什麼仍無法直接降低策略資金規模？**
  * 這是 OKX 交易所機制限制。策略開啟時的初始投入保證金無法直接提取或調低，即使目前沒有持倉也一樣。若需要降低資金規模，目前只能停止策略後，以較低金額重新開啟。較有彈性的做法是先用較小金額啟動，後續有需要時再追加資金。

### 智能洞察

* **CoinKarma Insight 是什麼？和 Ultron 有什麼不同？兩個可以一起用嗎？**
  * 兩者是獨立產品，定位不同。Ultron 是自動交易策略，基於 MPI 自動開關倉與加減倉，重點在交易執行與回撤控制；Insight 是自動復盤與機會挖掘系統，透過 AI 尋找高勝率交易 Pattern，觸發時會透過 Telegram 推送提醒。簡單來說，Ultron 幫你「執行」，Insight 幫你「發現機會」，兩者可以同時使用。
* **Insight 和 Ultron 的訊號邏輯有何差異？**
  * Ultron 基於 MPI（市場倉位指數）動態決定進出場時機與調倉比例；Insight 則透過 AI 掃描多個指標組合，在特定市場環境出現極端值時觸發訊號。若兩者同時出現同方向訊號，可將 Insight 作為輔助確認，但仍應依自身風控調整倉位，不宜因同向訊號就直接倍增部位。
* **Insight 智能洞察策略的回測記錄顯示進場訊號可達幾十次甚至上百次，但實盤無法全部跟上，回測報酬是否有水分？**
  * 回測引擎已套用與實盤一致的執行限制：同時最多持有 10 個倉位；總曝險不超過資金的 90%；每次進場量依策略歷史表現採 EV 加權動態調整；多空訊號同時出現時，選擇 EV 較高的方向。當訊號大量出現時，因倉位或資金限制而無法執行的訊號不會計入回測報酬，因此回測反映的是實際可執行訊號的累積績效。
* **Insight 智能洞察策略頁面顯示的出場閾值，為什麼會是 0.3042 這類非整數？**
  * 這是系統最佳化演算法自動運算出的精確參數。對整數計數邏輯而言，這類小於 1 的數值等同於 0，代表極端狀態需要完全消失才會觸發出場；只要仍有剩餘時段處於極端狀態，就不會平倉，待條件歸零後才執行。
* **Hyperliquid Vault 顯示負收益，但 CoinKarma 官網顯示正績效，哪個才準確？**
  * 兩者的計算邏輯不同。Hyperliquid Vault 的 PnL 會受到跟單者資金進出時間影響；若大部分資金是在策略運行一段時間後才進場，進場後恰逢回撤，Vault 顯示的絕對收益就可能偏低。官網績效則以固定本金從策略啟動時持續計算，不受跟單資金進出干擾，更適合用來觀察策略本身的完整表現。
* **Insight 的 LONG 訊號本質是什麼？Insight 目前有幾個 Pattern？**
  * Insight LONG 訊號的核心是均值回歸（Mean Reversion）：當市場情緒或流動性出現恐慌側極端值時，尋找反向做多機會；SHORT 則針對亢奮側極端。目前共有 16 個交易 Pattern，其中 6 個內建市場結構（Regime）Filter，另外 10 個為不區分行情的全局觸發，用戶無需手動切換。
* **Insight 是否每小時固定推送兩則訊息？**
  * 不是。Insight 只有在狀態發生變化時才會推送：個別策略在條件達標時發出訊號；CoinKarma Insight 總整理則會在出現新訊號、加碼、退出或方向變化時更新。若該小時沒有任何策略觸發，就不會推送訊息。
* **Insight 的 Telegram 通知突然停止推送，是功能出錯了嗎？**
  * 不一定。若目前市場沒有符合開倉、加倉、退出或方向變化條件的訊號，系統就不會推送通知。暫時沒有訊息通常代表當下市況尚未觸發條件，並不等同於功能異常。
* **Insight 進場時頁面顯示的止損價是固定的嗎？跌破就一定會止損？**
  * 止損價不是固定值，而會在每次進場或加倉後，依新的持倉均價動態重新計算。只有行情一次性跌破當下的動態止損門檻時才會觸發；均價重新計算後，最初頁面顯示的止損價不代表最終觸發位置。

### 指標使用

* **LIQ 指標 = 0 還是 = 1 代表買賣掛單平衡？**
  * 當買單總量等於賣單總量時，LIQ 值為 0。
* **LIQ 是透過哪些交易所取得的資料？為什麼 Alert 有 BTC/USD、ETH/USD，但圖表沒有？**
  * CoinKarma 圖表主要使用 Binance 的 USDT 交易對資料；而 Overall Liquidity Alert 中的 USD 交易對，例如 BTC/USD、ETH/USD，資料主要來自 Coinbase。因此，有些 Alert 中看到的 USD 交易對，不一定會在圖表中以相同形式顯示。
* **LIQ 是透過哪些交易所取得的資料？**
  * USDT 交易對主要為幣安，其中 Overall LIQ 裡的 USD 交易對，如 BTCUSD、ETHUSD 則是來自 Coinbase。
* **LIQ 跟 Overall LIQ 的差別是什麼？**
  * LIQ 是單幣的流動性指標，如果你 chart 開 BTCUSDT，那就是呈現 BTC 的 LIQ。
  * Overall LIQ 是以市值加權的整體流動性指標，不管開哪個交易對，都會呈現同樣的數據。
  * 簡單來說，一個看單一幣種，一個看整體市場，一起看比較能過濾出有意義的買賣點。
* **LIQ 指標要怎麼搭配倉位控管去做進出場？**
  * LIQ 指標偏向左側交易，較適用於震盪區間，在逆勢單邊可能會遇到連續止損，可以看個人的風險承受度去做，如分批進場：1 根綠柱進場 10%，第 4 根之後再 10%，或是等 Accumulate LIQ （過去24根K棒加總的LIQ）達到一定峰值再進場。
* **LIQ 屬于震盪指標，如果遇到單邊行情該怎麼辦？**
  * 需要有自己的濾網，端看自己的交易習慣，簡單的方式如以 200日MA 做為分界，200 MA 以上，可以用 LIQ 過濾最佳買點，若在 200MA 以下，做多就要較為保守。
  * 另外也可以看 CVD (cumulative volume delta) 去判斷單邊行情的強度，CVD 不斷往上才有可能突破 LIQ 紅柱的賣壓，反之亦然。
* **LIQ 指標的使用有推薦的時間週期嗎？**
  * 1 小時 (1H) 比較彈性，是最適用且推薦的時框。
* **LIQ Band 最佳使用方式？**&#x20;
  * 適合有掛單進出場需求的人使用，搭配雙幣理財策略效果更佳。
* **10% Orderbook DIF 指標參數應該填幣數量，還是美金名目價值？**
  * 若是在指標參數中設定，通常填的是幣數量差值。例如 BTC/USDT 的 Bid/Ask 差值是 2000 顆，就填 2000。這與 Custom Signal 預設值 2000 / -2000 的概念一致。
* **10% Orderbook DIF 在 Custom Alert 裡怎麼設定 Notional USD 數值？**
  * 若是在 Custom Alert 中使用 Notional USD，請先點擊指標旁的設定，將 Notional USD 勾選起來；Custom Alert 也選擇 Notional USD，再填入美金差值。例如填入 100000000，代表 100M 美金。
* **10% Orderbook DIF 的 low benchmark 為什麼看起來不像是根據柱子長短標色？**
  * 10% Orderbook DIF 的 benchmark 標色邏輯是基於標準化後的比值，而不是柱子的原始絕對數值，也就是 raw USD difference。
  * 簡單來說：柱子長短反映的是原始差值大小；紅色或綠色標色反映的是標準化後的比值是否超過 benchmark。
  * 所以有時候柱子看起來很長，但如果當時整體訂單簿基數也很大，標準化後不一定會觸發標色；反過來，柱子看起來沒那麼極端，但如果當時訂單簿基數較小，也可能因為比值較高而觸發標色。
* **Charts 裡的 MPI 為什麼不是即時更新，而是每小時收線後才更新？**
  * MPI 需要聚合多項指標數據，因此設計上就是在每小時收線後才更新，並不是即時變動指標。
* **為什麼 Telegram 頻道推播的 Alert 數值，跟網頁版圖表上的數字有落差？**
  * 這是因為兩者抓取資料的時間點不同。Alert 警報為了確保第一時間通知，會抓取當下最新的即時數據；而圖表上的 K 線顯示的是整點收線那一瞬間的固定快照，因此兩者可能會有差異。
* **CME Smart Money 的更新時間？**&#x20;
  * 台北時間 (UTC+8) 星期六 更新當周 星期二 的倉位狀況（遇節慶順延一週）。
* **LIQ 是每小時計算一次嗎？會被 Spoofing Order (虛假掛單) 影響嗎？**&#x20;
  * LIQ 是實時更新，每小時結算一次。理論上會被 Spoofing 影響，但要影響 BTC 這樣大體量的幣種需要極大資金，一般很少見。小幣的 LIQ 參考程度則需要配合主觀判斷。
* **OI-Weighted Funding Rate 圖表顯示跟文檔不一樣（上下都綠色）？**
  * &#x20;文檔介紹有另外設置 benchmark (如 0, 0.03)。用戶也可以自行設定 benchmark 參數來調整顯示顏色，以符合自己的觀察習慣。
* **市場環境頁面顯示「盤整」，但日線已出現價格 < EMA21 < EMA50 的排列，是系統延遲嗎？**
  * 不一定是延遲。系統設有防抖動機制，需要連續滿足下跌條件 3 天以上，市場環境才會由「盤整」切換為「下跌趨勢」，以避免短期波動造成狀態頻繁切換。若日線持續維持該排列，並同時低於 SMA200 滿 3 天，環境才會正式更新。
* **CoinKarma 圖表中顯示的成交量，是綜合全市場的成交量嗎？**
  * 不是。各幣種使用的現貨成交量資料來源可能不同：BTC 等主流幣種主要採用 Binance 現貨成交量；HYPE 則採用 OKX 的 HYPE/USDT 現貨成交量。
* **CoinKarma 平台顯示的 HYPEUSDT LIQ 數據，來自哪個交易所？**
  * HYPEUSDT 的 LIQ 數據來源為 Hyperliquid（HL）上的 HYPE/USDC 交易對資料。

### 回測＆策略機器人

* **請問建立送出策略機器人後，通常多久會審核通過？**
  * 信號需等待 OKX 審核通過，原則上每個工作日於中午 12 點（亞洲時間）會過審，最晚 T+1 會過審，。若超過半個月仍顯示待處理，建議重新部署或聯繫客服回報 Bug。
* **為什麼策略條件加入 Short Filter 後，機器人訊號無法正常發送？**
  * 若 Short Filter 指標長時間沒有觸發，而策略條件又設定為 short\_filter == 1，就會導致進場條件一直不成立，機器人自然不會發送訊號。這在技術上不是 Code Bug，而是條件沒有被滿足。
  * 建議：若策略長時間沒有觸發，可以先檢查該指標近期是否有有效訊號，再決定是否適合作為進場條件。
* **在 OKX 建立信號機器人時提示「API 金鑰已存在」，可以刪除舊的 CoinKarma API 嗎？會影響 Ultron 跟單嗎？**
  * 可以刪除，不會影響 Ultron。Ultron 跟單及信號機器人的開關單，與 CoinKarma API 無關。CoinKarma 綁定 API 主要是為了讀取並在網頁呈現績效，權限為 Read-only，沒有交易權限。
* **實盤機器人漏單未進場，是因為實盤與回測設定的「起始時間」不一樣嗎？**
  * 有可能。回測與實盤起始日期需要一致，否則可能導致兩者資金狀態不同步。例如回測因為較早進場已經把資金用完，但實盤仍有資金空倉等待，就可能造成實盤和回測結果不同。另外，由於資金費率、手續費等因素，回測與實盤仍可能有些微差異，但原則上不會差太多。
* **策略回測工具中的「進場比例」是怎麼計算？為什麼設定 10% 進場，次數可能超過 10 次？**
  * 目前版本的進場比例是基於當下可用資金或帳戶狀態計算，而不是把初始本金固定等分。例如設定每次進場 10%，並不代表最多只能進場 10 次；只要帳戶仍有剩餘資金，或浮盈使帳戶總值變化，當入場條件再次觸發時，系統仍可能繼續補倉。
  * 舉例來說，若一開始可用保證金是 1000U，第一次 10% 是 100U；加倉後剩餘資金變化，下一次會基於新的帳戶狀態計算。因此進場次數可能超過理論上的 10 次。後續策略回測 V2 會支援選擇「起始保證金」或「剩餘保證金」作為加倉基準。
* **回測系統設定 5% 是指每次符合條件就進場嗎？能設定總資金上限嗎？**
  * 是的，每次符合條件會按照設定比例進場。不需要另外設定總資金上限，因為每個 Signal Bot 都是逐倉（Isolated），建議直接分配特定金額，例如 3000U，給該 Bot 跑即可。
* **指標 05 分才推送，導致回測與實盤有 5 分鐘滑點落差，能同步嗎？**
  * 目前延遲主要是因為系統需要等待所有數據計算完成後，才會發送 Alert。延遲進出場在不同行情下可能有好有壞，有時延遲反而會讓成交價格更有利。不過，為了提升回測精準度，盡可能縮小回測與實盤延遲落差已列入開發 Backlog，後續會持續優化。
* **回測中 MPI 在 7:00 滿足進場條件，但記錄的入場時間是 8:00，這是延遲嗎？**
  * 這不是普通延遲，而是刻意設計的防作弊機制。回測執行邏輯是「當根 K 棒收線出訊號，下一根 K 棒開盤價執行」。
  * 原因是，在真實交易中，當你看到收盤價時，該價格已經成為過去，最早能拿到的成交價是下一根 K 棒的開盤價。如果回測使用當根收盤價執行，會造成績效虛高，也就是 look-ahead bias / 未來函數問題。因此這個設計是為了讓回測結果更接近真實交易。
* **在 OKX 設置了平倉條件，例如漲跌幅 15%，但畫面顯示報酬率已經到 18% 卻沒有平倉，為什麼？**
  * 因為兩者使用的計算口徑不同。OKX 設定中的「漲跌幅」通常指標的價格相對持倉均價的變動；畫面顯示的 18% 則可能是加上槓桿後的收益率。CoinKarma 策略編輯器中的止盈止損以價格漲跌幅為基準，若要與 CK 設定對應，請在 OKX 選擇「漲跌幅」，不要直接用槓桿後收益率判斷是否應觸發。
* **回測裡的止盈止損是怎麼計算的？為什麼止損設 20%，MDD 仍可能超過 20%？**
  * 回測中的止盈止損是依照倉位的平均進場成本計算。例如進場均價為 100，止損設為 10%，價格跌破 90 時才會觸發止損。
  * MDD 則是淨值曲線從高點到低點的最大回撤，計算的是整體帳戶淨值變化，包含浮盈浮虧與槓桿影響。因此，即使單筆倉位止損設為 20%，若期間有連續虧損、槓桿放大或浮盈回撤，最大回撤仍可能超過 20%。
* **OKX 增加保證金時，「計入本金」與「不計入本金」有什麼差別？**
  * 勾選「計入本金」時，追加資金會被視為新的策略本金，後續會納入加倉、減倉與平倉計算。
  * 不勾選時，追加資金只會作為補充保證金，用來降低爆倉風險，不會影響策略本金。
  * 簡單來說：勾選 = 加本金；不勾選 = 加安全墊。若希望新增資金參與後續策略倉位計算，增加保證金時請務必勾選「計入已投入保證金」。
* **在策略執行中手動動用策略帳戶的資金，後續機器人邏輯如何應對？**
  * 策略不會自動對齊實際倉位，仍會依照信號差值繼續執行。手動介入後可能導致兩種情況：
    1. 買入信號因保證金不足而下單失敗；
    2. 賣出信號只處理策略自身倉位，不會涵蓋手動單。
  * 因此建議避免在策略資金中混入手動操作，以免倉位長期偏移。
* **自建策略裡有設定止盈止損，OKX 實盤會自動執行嗎？**
  * 不會自動執行。策略裡的止盈止損設定僅供回測參考，OKX 實盤需要在 OKX 機器人設定中手動填上。
  * 如果多單與空單需要不同的止盈止損參數，建議拆成兩個 OKX 機器人分別設定。
* **策略編輯器是用哪個時框？**&#x20;
  * 策略編輯器使用的是 1 小時 (1H) 時框。
* **為什麼回測的回撤數據和倉位記錄對不上？**
  * 最大回撤 (MDD)：計算的是持倉期間的浮動虧損 (Floating PnL) 最大值。
  * 倉位記錄：顯示的是平倉後的已實現盈虧 (Realized PnL)。
  * 很多時候持倉過程浮虧很大，但最終可能是獲利出場，因此兩者數據不同。
* **為什麼自製交易機器人會出現「未預期的平倉訊號」或報錯？**&#x20;
  * 這通常發生在多空策略混合時。例如：策略發出「平空」信號，但您當前是「空手」狀態，交易所就會報錯。只要確認當下確實無倉位，忽略此報錯即可，不影響資金安全。
* **CoinKarma 自定義機器人如何實現「停止開新單、但保留目前倉位」？**
  * &#x20;目前系統無直接暫停按鈕。變通方法：將機器人的「入場規則 (Entry Rule)」修改為一個永遠無法觸發的條件。這樣機器人不會開新單，但舊倉位仍會依規則平倉。
* **為什麼回測機器人裡找不到 Karma Index, CVD 等指標？**
  * &#x20;機器人主要支援適合 1H Reversion (反轉) 策略的指標。非此類型的通用指標暫未加入列表。
* **CoinKarma 策略編輯器中的止盈止損，對應到 OKX 時應選「漲跌幅」還是「收益率」？**
  * 應選擇「漲跌幅」。CoinKarma 策略編輯器的止盈止損，是以持倉均價的價格漲跌幅為基準計算，而不是加上槓桿後的收益率。

### DCA 馬丁 Signal

* **DCA 馬丁交易訊號的歷史勝率，是根據多久的數據進行回測的？**
  * DCA 馬丁交易訊號的歷史勝率，是根據 2023 年至今的歷史數據進行回測驗證的結果。
* **目前要如何跟單 DCA 馬丁策略？是像 Ultron 一樣全自動嗎？**
  * 目前 DCA 馬丁策略採用「手動跟單」。當頻道發出新信號時，點擊信號下方的 OKX 專屬連結，根據 APP 或網頁版入口前往跟單配置即可。
* **跟單 DCA 馬丁策略後，還需要自己手動管理倉位或平倉嗎？**
  * 不需要。跟單後，系統會根據 LIQ 指標自動判斷出場條件，不需要手動管理倉位。系統平倉後，也會自動發出關單通知。
* **DCA 馬丁策略和 Ultron 是同一個嗎？會互相影響嗎？**
  * 兩者完全獨立，互不影響。Ultron 是針對 BTC 的均值回歸策略；DCA 馬丁信號則是針對 20 個主流山寨幣種，根據流動性與相對 BTC 強弱篩選後發出的多空訊號。兩者可以同時跟單。

### 其他

* **邀請好友使用 CoinKarma 會有獎勵嗎？**
  * 透過個人邀請連結邀請好友加入，你與好友都將獲得 15% 的訂閱延長點數，可於「點數商店」兌換訂閱。若為 KOL，可透過此[連結](https://forms.gle/DXkodkvXrYhU6yiP8)進行申請 Affiliate Program，會有 USDT 回饋。


# LIQ 🔥

## 快速上手 LIQ

說明：LIQ 是透過該幣種的現貨訂單簿數量的比值去標準化建置的指標。

使用情境：震盪行情。

操作訊號：

* LIQ > 3：買入(做多)；代表該幣買方流動性較多，較可能形成震盪行情的底部。&#x20;
* LIQ < -3：賣出(做空)；代表該幣賣方流動性較多，較可能形成震盪行情的頂部。

<figure><img src="/files/urGXA078gOiqtRQY2X4M" alt=""><figcaption></figcaption></figure>

操作提醒：

1. 在 LIQ 預設值為 ±3 的情況下，買賣點需要抓 Buffer，用戶可以透過指標設定，自行調整預設值，或是透過策略編輯器設定參數並回測。
2. LIQ 適用的操作情境為「震盪行情」，當行情由「震盪→單邊趨勢」，必然會有所止損，用戶可以參考 Long/Short Filter 的條件，進行止損，避免損失擴大。

## 快速上手 Overall LIQ

說明：Overall LIQ 是透過整體市場的現貨訂單簿數量的比值去標準化建置的指標。

使用情境：震盪行情。

操作訊號：

* Overall LIQ > 2：買入(做多)；代表整體市場買方流動性較多，較可能形成震盪行情的底部。&#x20;
* Overall LIQ < -2：賣出(做空)；代表整體市場賣方流動性較多，較可能形成震盪行情的頂部。

<figure><img src="/files/Bk6Me1frcpTE5AMfjitp" alt=""><figcaption></figcaption></figure>

操作提醒：

1. 在 Overall LIQ 預設值為 ±2 的情況下，買賣點需要抓 Buffer，用戶可以透過指標設定，自行調整預設值，或是透過策略編輯器設定參數並回測。
2. Overall LIQ 適用的操作情境為「震盪行情」，當行情由「震盪→單邊趨勢」，必然會有所止損，用戶可以參考 Long/Short Filter 的條件，進行止損，避免損失擴大。

## 快速上手 Accumulated LIQ

說明：Accumulated LIQ 是該幣種 LIQ 的累積加總。

使用情境：震盪行情。

操作訊號：1小時時框

* Accumulated LIQ > 60：買入(做多)；代表該幣買方流動性已累積較多，較可能形成震盪行情的底部。&#x20;
* Accumulated LIQ < -60：賣出(做空)；代表該幣賣方流動性已累積較多，較可能形成震盪行情的頂部。

![](/files/qBdKKanrdCZWI71EqSLt)

操作提醒：

1. 在 Accumulated LIQ 預設值為 ±60 的情況下，買賣點需要抓 Buffer，用戶可以透過指標設定，自行調整預設值，或是透過策略編輯器設定參數並回測。
2. Accumulated LIQ 適用的操作情境為「震盪行情」，當行情由「震盪→單邊趨勢」，必然會有所止損，用戶可以參考 Long/Short Filter 的條件，進行止損，避免損失擴大。

## 快速上手 10% Orderbook DIF

說明：10% Orderbook DIF 是該幣種 10% bid-ask 的差值。

使用情境：震盪行情。

操作訊號：

* 10% Orderbook DIF > 2000：買入(做多)；代表買方流動性較多，較可能形成震盪行情的底部。&#x20;
* 10% Orderbook DIF < -2000：賣出(做空)；代表賣方流動性較多，較可能形成震盪行情的頂部。

<figure><img src="/files/i1ZctnVYdDZbP20oSRco" alt=""><figcaption></figcaption></figure>

操作提醒：

1. 在 10% Orderbook DIF 預設值為 ±2000 的情況下，買賣點需要抓 Buffer，用戶可以透過指標設定，自行調整預設值，或是透過策略編輯器設定參數並回測。
2. 10% Orderbook DIF 適用的操作情境為「震盪行情」，當行情由「震盪→單邊趨勢」，必然會有所止損，用戶可以參考 Long/Short Filter 的條件，進行止損，避免損失擴大。

## 快速上手 10% Overall Liquidity

說明：10% Overall Liquidity 是整體市場 10% bid-ask 的差值。

使用情境：震盪行情。

操作訊號：單位：USD

* 10% Overall Liquidity > 300M：買入(做多)；代表整體市場買方流動性較多，較可能形成震盪行情的底部。&#x20;
* 10% Overall Liquidity < -300M：賣出(做空)；代表整體市場賣方流動性較多，較可能形成震盪行情的頂部。

　　單位：BTC

* 10% Overall Liquidity > 3000顆：買入(做多)；代表整體市場買方流動性較多，較可能形成震盪行情的底部。&#x20;
* 10% Overall Liquidity < -3000顆：賣出(做空)；代表整體市場賣方流動性較多，較可能形成震盪行情的頂部。

<figure><img src="/files/Szsoy0f3iMKpKuzWrB5D" alt=""><figcaption></figcaption></figure>

操作提醒：

1. 在 10% Overall Liquidity 預設值為 ±300M(3000顆) 的情況下，買賣點需要抓 Buffer，用戶可以透過指標設定，自行調整預設值，或是透過策略編輯器設定參數並回測。
2. 10% Overall Liquidity 適用的操作情境為「震盪行情」，當行情由「震盪→單邊趨勢」，必然會有所止損，用戶可以參考 Long/Short Filter 的條件，進行止損，避免損失擴大。

***

## 什麼是 LIQ 指標

<figure><img src="https://lh7-rt.googleusercontent.com/docsz/AD_4nXfhtwjMEYAlp9-ojFuTDjZA36ygyyDa8fFtJdAvOihnMHFUy23CN7sKdnvpb5Bp3Bn-YnzHxVs26p5CD6lSk0Gy0_5cLucmuV-erzh5gQe71uaGMp5fQ8qCiNTDI0gZ1BEljHxKPA?key=luLiz2GY4XjFT_nYY-mTIQJp" alt=""><figcaption><p>(註:圖表紅綠箭頭是對應 LIQ 指標)</p></figcaption></figure>

在深入介紹 LIQ 指標的原理之前，我們先了解加密貨幣市場會被哪些因素影響：

● 長線因素：影響外部資金流入流出幣圈，這些因素決定了是否會形成單向的「趨勢行情」

* BTC 採用率：圈外有多少人認同 BTC 的價值資產，2024 年比特幣通過 ETF 即是一例
* 整體貨幣市場的流動性：美元升降息、世界三大央行擴/縮表
* 幣圈是否有可以吸引外部資金的題材：eg. DeFi、NFT、ICO<br>

● 短線因素：影響短線走勢的主要驅動因素 「清除高槓桿」，上沖下洗形成「震盪行情」

* 合約市場的高槓桿：幣圈交易者普遍喜歡開高倍槓桿玩合約，使合約成了主力收割散戶籌碼的主要手段，因此短線上的走勢往往受到合約數據的影響。         &#x20;
* 站在主力的角度思考：主力要控制價格收割高槓桿玩家籌碼時，會去評估操控價格的所需的資金成本以及潛在獲利，只有潛在獲利遠高於成本主力才有誘因去行動。<br>

***

而 LIQ 就是用來判斷「震盪行情」走勢的指標，以下深入解析 LIQ 背後的邏輯：

● 基本邏輯：LIQ 是透過現貨訂單簿數量的比值去標準化建置的指標。

* 訂單簿是由買單 (bid) 以及賣單 (ask) 所組成。
* 透過 CoinKarma 獨家算法，**標準化計算出主力拉盤和砸盤的成本較大的區間，如果主力控制價格的成本大於操盤的獲利，就有可能形成價格反轉點**。

●判斷邏輯：透過 LIQ 指標判斷主力拉盤或砸盤的操作成本。

* 當 LIQ 偏高（>3）時，代表下方訂單簿買盤較深，主力砸盤的資金成本較高，較可能形成震盪行情中的底部。
* 當 LIQ 偏低（<-3）時，代表上方訂單簿賣盤較深，主力拉盤資金成本較高，較可能形成震盪行情中的頂部。

> 簡言之，LIQ 就是窺看主力拉盤和砸盤的成本，當控制價格的成本過高，行情較可能出現轉折如何運用 LIQ 指標幣圈 90% 的行情都是震盪行情，單邊上漲或下跌的佔比較低，當行情處於寬幅震盪時期，就是 LIQ 指標發揮最大效用的時候。

***

● 單以 LIQ 指標作為行情介入點

若我們將白框內的走勢定義為大型震盪區間，可以發現 LIQ 基本上把區間底、區間頂都標示出來了。( benchmark 為 3,-3 )

<figure><img src="https://lh7-rt.googleusercontent.com/docsz/AD_4nXdATwXaOd-geOyh-LquhQ6lfXwva3872jQgvjaziwTuHkTjRw3w6vx0CTUFjmSnUGS5qiTC4zACibY4XSihUmmSLpHs72n-FqCaHqzW3JV9Tpve2xQI9cw140CkHTeGl4-aCvXZhA?key=luLiz2GY4XjFT_nYY-mTIQJp" alt=""><figcaption><p>(註:圖表紅綠箭頭是對應LIQ指標)</p></figcaption></figure>

在下圖中， Overall LIQ>2 且 BTC LIQ >3 會顯示綠色箭頭；Overall LIQ<-2 且 BTC LIQ <-3 會顯示紅色箭頭。從以下圖中可以發現，震盪行情中第一次出現綠色箭頭到真的觸底，往往還會有一大段距離，這是因為幣圈合約市場天然偏多頭的特質，清算多頭往往比清算空頭更有利可圖，因此就算主力往下砸盤成本較高，也可能出現繼續往下砸的狀況。

反之，第一次出現紅色箭頭到真的觸頂，距離就比第一次綠色箭頭到真的觸底還近很多，因此在實際操作上，會建議 LIQ 出現綠柱子後可以慢慢建立多頭倉位；LIQ 出現紅柱後可以較快平倉。<br>

<figure><img src="https://lh7-rt.googleusercontent.com/docsz/AD_4nXdJ-ltwsZ6SvhRNRFR-CxQlc5sMKXJRqhiaAPulL__1eTeuhuNY25wzm3mMaGmyunomNcCIVwhezX77NNGCRygVQ1uLzeNQpPZPkTwlCCiGXQG0OEg8sRfSfo9_lefsodAqsZtR?key=luLiz2GY4XjFT_nYY-mTIQJp" alt=""><figcaption><p>(註:圖表紅綠箭頭是對應LIQ指標)</p></figcaption></figure>

● 以 CVD 作為當 LIQ 指標過度延伸時的警訊

LIQ 是基於現貨訂單簿-限價單資料 (bid & ask) 運算出的指標，而當市場上市價買盤的力道足夠大時(CVD 會上升)，就會使指標數據過度延伸，因此我們可以透過 CVD (市價買賣盤的力道) 去過濾掉單邊行情，避免在單邊上漲行情做空。<br>

<figure><img src="https://lh7-rt.googleusercontent.com/docsz/AD_4nXcJqhPhGyGl1K9f5TDkcIhgz3T_QUTFqznlPsONjMFii7AB8OulAkDv9uVz-be92_nQZz1Y-KRzh2AHzObvo-WGULndNbtNn-LsqZtvBApasiWiynN_fcx17yncnAv3DCJ5b2gf9g?key=luLiz2GY4XjFT_nYY-mTIQJp" alt=""><figcaption></figcaption></figure>

● 以其他 CoinKarma 數據指標輔佐 LIQ 作為行情介入點

CoinKarma 基於 LIQ 指標所成立，同時也開發許多指標去輔佐 LIQ 以應付不同行情，以下舉例：

&#x20;         ◦ LIQ + Accumulated LIQ  : 用更嚴格的濾網作為進出場的條件，但相對交易機會較少。

<figure><img src="https://lh7-rt.googleusercontent.com/docsz/AD_4nXfGMIyX76v0ReMa3RYIWVie3wcIqFaxYmWE_nhFyz2hNe077DYiLUq-RqaHgZk7s4XoNpr2ckkUW-NcJ1PrD_IaHzyd_RtivSUKbFYVBIgMIDt4BXIu825GeOzc02Nr5F1h_ZRZCQ?key=luLiz2GY4XjFT_nYY-mTIQJp" alt=""><figcaption><p>紫框為 LIQ ；黃框為 LIQ + LIQ Accumulated</p></figcaption></figure>

&#x20;           ◦ LIQ + ALT Resilient Index : 用更嚴格的濾網作為進出場的條件，但相對交易機會較少。

<figure><img src="https://lh7-rt.googleusercontent.com/docsz/AD_4nXcp_j1C7RttqCMZVq78S7jFq7apVfC1DNoPyIR7GOlKDS2w1WiOmyBVnCXkx_mHA74-Cq-t0VUJj9Z-MKOyXNK7QF6a-izJSyvUTu8YV8Dfdwj9Byur2yu2as6_vJepg0mylhU9?key=luLiz2GY4XjFT_nYY-mTIQJp" alt=""><figcaption><p>紫框為 LIQ ；黃框為 LIQ + ALT resilient Index</p></figcaption></figure>

<br>

以上舉例兩種配置，用戶可以透過 CoinKarma 指標的各種搭配加以復盤，去建置以 LIQ 為主體的交易策略。

下段主題將介紹以 LIQ 邏輯衍生出的數據指標及其應用。

***

以 LIQ 邏輯建置的指標：Overall LIQ、Accumulated LIQ、10% Orderbook DIF。

### Overall LIQ

原理：Overall LIQ 指標原理基本上與 LIQ 相同，基於現貨訂單簿-限價單資料(bid & ask)運算出的指標。

差異：LIQ 是單幣的流動性指標，如果你 chart 開 BTCUSDT，即呈現 BTC 的 LIQ。

Overall LIQ 是以「收錄進 CoinKarma 的所有幣種，以市值加權計算的整體流動性指標」，無論開哪個交易對，都會呈現同樣的數據；簡單來說，LIQ 看單一市場， Overall LIQ 看大盤。 &#x20;

應用：

◦ LIQ + Overall LIQ ：Overall LIQ 相較於 LIQ 更為敏感，能提供更多短線上的交易機會

<figure><img src="https://lh7-rt.googleusercontent.com/docsz/AD_4nXdSHLcrHUDr9XaEUBGvCigF_jj3cI8CZ0tkiZf_KZH-aOxWyOUCjqpQ8s7wcsQ4qPHb-uxjUBngwcknf4DWoxFX-gu6BqcNnXOdp5rZ-V5G2t1C1eIwvrYjT8GrmwamoIyXPeBMOA?key=luLiz2GY4XjFT_nYY-mTIQJp" alt=""><figcaption></figcaption></figure>

***

### Accumulated LIQ

原理：為 LIQ 加上「時間」的概念。其原理為 LIQ 的累積加總。

應用：預設值為（24, 60, -60），用於觀測過去 24 根 LIQ 的數值加總，在不同時框下也有不同的效果，用戶可自行透過覆盤調整參數。

以下提供兩種參數：

◦ 1小時時框 ：設定（24, 60, -60）

<figure><img src="https://lh7-rt.googleusercontent.com/docsz/AD_4nXe1EscammqhejZOFzLB_tovgVHp8byROQjBHr133nvonHfPH873onN2PhJoDS5cCwhdQ_DnFVvIPQ3sWuXaGpSu6AfLtURwOuu08gl5tE5sZ-hEmzyU-MDOUdUPf_BOnrkzjBHb6A?key=luLiz2GY4XjFT_nYY-mTIQJp" alt=""><figcaption><p>(註:圖表紅綠箭頭是對應 Accumulated LIQ 指標)</p></figcaption></figure>

◦ 4小時時框 ：設定（50, 100, -100）

<figure><img src="https://lh7-rt.googleusercontent.com/docsz/AD_4nXfcGywL2tkOuT_JzZ-pwPef6LwwxpS_uGYu7j4PBLwXdjhyRRUFun-bXyFWJapg9VT9eSEqxh7oC5inTjxB34wulTEULoKzr_MGdEw93XnRZbpB2o0FLSXaTtJkEiD6OeH18ZBgcg?key=luLiz2GY4XjFT_nYY-mTIQJp" alt=""><figcaption><p>(註:圖表紅綠箭頭是對應 Accumulated LIQ 指標)</p></figcaption></figure>

***

### 10% Orderbook DIF

原理：該幣種 Orderbook 10% bid-ask 的差值，透過指標設定可進階選擇顯示該幣的 Notional USD，為該幣的美金名目價值，用以判斷該值的絕對價值。

應用：透過 10% Orderbook LIQ-Notional USD，可以發現在相同 LIQ 數據下，黃框的買方流動性 > 紫框的買方流動性。

<figure><img src="https://lh7-rt.googleusercontent.com/docsz/AD_4nXeDJiBGfjrPmcHgh1Q1-c7uXpB3FVDsfEXFh3SEsYWGAoHxJZO7RBV17vc68oQf2Wt4azuXH_08PDDT0ZCM63M7GIhOGa_U7zLG4_6twQDCxPBudswewjxeyggWlf_OnR4S2QYK?key=luLiz2GY4XjFT_nYY-mTIQJp" alt=""><figcaption></figcaption></figure>

***

### 10% Overall Liquidity

原理：整體市場 orderbook 10% bid-ask 的差值。( [參考目前 CoinKarma 收錄進 Overall LIQ 的幣種](https://docs.coinkarma.co/indicators-guide/liq#overall-liq) )

應用：透過 10% Overall Liquidity，可以發現在相同 Overall LIQ 數據下，黃框的買方流動性 > 紫框的買方流動性。( 預設值為 300m , -300m )

<figure><img src="https://lh7-rt.googleusercontent.com/docsz/AD_4nXfQLt4V_amZH3fVesRGuK2kIaZrjeqYo1NmjtYC-wSsfVFD5rFFrmEtHMEvwaBbxu0k1F9cNaXffcNATDWHyLW5d2K2f7j08xjJYDSPfjrY6x1kP2HK1pbTxElP-1BjO36IR21zoQ?key=luLiz2GY4XjFT_nYY-mTIQJp" alt=""><figcaption></figcaption></figure>

10% Overall Liquidity - Show in BTC，透過指標設定可以選擇 Show in BTC。( 預設值為 3000顆 , -3000顆 )，原理為整體市場 orderbook 10% bid-ask 的差值除以當前BTC的價格；以多頭為例，透過復盤可以發現，其對價格具有高度的指導性。

<figure><img src="https://lh7-rt.googleusercontent.com/docsz/AD_4nXe8sQ_6tGGhyHGmHbfPMtaOBX88q4_VsDJdG5cVCMyyVWaZmkTsVW9-lg84OjPrJeJP-0qG-_yEbtGGXfd0urc9QpWhB8f73ztP1eal8mM4NEn1zXonYRpxlb4BPdjorzYNnE4HHA?key=luLiz2GY4XjFT_nYY-mTIQJp" alt=""><figcaption></figcaption></figure>

***

***

## 結語-LIQ 指標(及衍生出的相關指標)的適用場景及其侷限性

因以 LIQ 邏輯建置的數據指標，其適用場景及侷限性相似，以下以 LIQ說 明

● LIQ 指標的適用場景

LIQ 是基於短線因素的震盪行情指標，在場內資金沒有因為某些因素而大量流入或流出時，就是 LIQ 指標發揮最大效用的時候。

<figure><img src="https://lh7-rt.googleusercontent.com/docsz/AD_4nXfjzx250AuBczt0tn9nS1eJ6kVaycD-IVT2UJoQg9CGtjHy2lf8LM0fr6iGkj1TVV1and7GTV7HqtndeNw3WKd52O4rh-uaeQ0AWG4Micfc6WDWEAWuBk6m2wOj-BdfR1-_fa0J?key=luLiz2GY4XjFT_nYY-mTIQJp" alt=""><figcaption></figcaption></figure>

● LIQ 指標的侷限性

◦ 當震盪行情轉為趨勢行情：如同指標的適用場景所述，LIQ 是震盪行情的指標，當行情由震盪轉為趨勢時，必然會有所止損。 以下舉例： 2024 / 11 川普當選總統後，短時間湧入大量資金購買 BTC，短時間內將 BTC 從 67K 推至新高 99K，形成單邊趨勢，此時會出現紅柱鈍化的情形。

<figure><img src="https://lh7-rt.googleusercontent.com/docsz/AD_4nXfv9Z2XsaDAKoE5YaZH46FHFpZOGW0UAjaUZC4Ce4JXeedl0rNAoU3TLLuEQqwsX_tO4CqKt3RR7H0MuD-LI1USg8gdVnzu8OubLZLNmF1r3yVC97eK39a8vcXtbdbYxAg6z6SrYQ?key=luLiz2GY4XjFT_nYY-mTIQJp" alt=""><figcaption></figcaption></figure>

◦ 長線因素的影響：當某些因素的影響造成場內資金的大量流出或流入時，也會使 LIQ 的效果銳減。

以下舉例：2022 年加密貨幣第一次遭遇到美聯儲 30 年來最快速度的加息，資金不斷從幣圈流出，也會造成指標鈍化。

<figure><img src="https://lh7-rt.googleusercontent.com/docsz/AD_4nXd8AWZrvVEfVt_3Xfwpyl9fI2xkGxU3ZweC3ivXlGwrjMvLPA1xNB-oijsWX8mzaYSsoatmkgET1xhS82DtNAtCmBplj0qIuKNz4SsbJS8-i42U01UMC4RYCv97B8uL6nysWi3viA?key=luLiz2GY4XjFT_nYY-mTIQJp" alt=""><figcaption></figcaption></figure>

◦ 個別幣種的的 LIQ 門檻可能不同：因為不同幣種的造市風格可能有所差異，單純以 LIQ 預設的值（ +3, -3）去做 filter，可能未必準確，此時可點及小齒輪調整 benchmark 可解決準確率的問題。

&#x20; 以下舉例：SUI/USDT；LIQ benchmark 設定為-3,3(紫框)，若我們將條件設定為-3,5(黃框)，可以篩選出更好的進場位置。

<figure><img src="https://lh7-rt.googleusercontent.com/docsz/AD_4nXcT94kKvt6ti10H8KCFnfMpoc2Aod47917eoj_x4zPNOrsfEP-tsgm-QautQFwyWzm__3trUuSzSg01vpkpVhUBY9512qUVYgZ9L_Cl-vt-vGHE6JGtMCETcRKAht01IzFMtqSJbg?key=luLiz2GY4XjFT_nYY-mTIQJp" alt=""><figcaption></figcaption></figure>

{% hint style="info" %}
**使用須知**\
感謝您使用 CoinKarma，本平台提供的數據指標主要基於過去的歷史表現，無法完全預測未來的市場走勢。加密貨幣市場具有高度的波動性，使用者應謹慎評估風險，並為自己的決策負責。
{% endhint %}

<br>


# Market Pulse 🔥

## 快速上手 Market Pulse Index

說明：Market Pulse Index 是將 CoinKarma 的 11 種指標綜合計算出 0-100 的指數。

使用情境：震盪行情。

操作訊號：

* Market Pulse Index < 20：買入(做多)；代表場內多項因子偏向看漲，較可能形成震盪行情的底部。&#x20;
* Market Pulse Index > 80：賣出(做空)；代表場內多項因子偏向看跌，較可能形成震盪行情的頂部。

<figure><img src="/files/Fr41g1VIVHlATMTCGD4h" alt=""><figcaption></figcaption></figure>

操作提醒：

1. 在 Market Pulse Index 預設值為 「< 20－買入(做多)」；「> 80－賣出(做空)」的情況下，買賣點需要抓 Buffer，用戶可以透過指標設定，自行調整預設值，或是透過策略編輯器設定參數並回測。
2. Market Pulse Index 適用的操作情境為「震盪行情」，當行情由「震盪→單邊趨勢」，必然會有所止損，用戶可以參考 Long/Short Filter 條件，進行止損，避免損失擴大。

***

## 什麼是 Market Pulse

Market Pulse 是將 CoinKarma 的 11 種指標綜合計算出 0-100 的指數。

<figure><img src="/files/YjaEKLRB7L2Rk9FvROKr" alt=""><figcaption></figcaption></figure>

## 如何運用 Market Pulse

#### Market Pulse 整體

* Market Pulse ≤ 20：潛在反轉買入機會&#x20;
* Market Pulse ≥ 80：潛在反轉賣出機會&#x20;

<figure><img src="https://lh7-rt.googleusercontent.com/docsz/AD_4nXdWyayIkm3_S7ne0pj_S6AWNiIzdtJA43zZHWJU8LvHkIZEO-RKtYuRHnRmIyop2dP6vCtFtiUbJxvCqbVhipCmwVzDRSDB-QE3No-hDxpXM246KtQpxo-TwbfWECWWNmaeL0fOIA?key=luLiz2GY4XjFT_nYY-mTIQJp" alt=""><figcaption><p>用戶可以透過 CoinKarma 的圖表復盤 Market Pulse </p></figcaption></figure>

#### Market Pulse 個別指標

🟢 潛在反轉買入機會

⚪ 維持觀望

🟠 需警慎，注意下行風險

🔴 潛在賣出轉買入機會<br>

<figure><img src="https://lh7-rt.googleusercontent.com/docsz/AD_4nXdPmp4VsDPgkB_fOPdz6AkbPijV3thO588pE6dUWpVf0dfH92n2uUoYw5pqh_FAVHFjWwa1VV8Hqsqiv7Aa2m56ixeI7_Safkz3Q8P4ISE_4Kq9HsXTDNAPSi53_sVLG2G5A3uQ?key=luLiz2GY4XjFT_nYY-mTIQJp" alt=""><figcaption><p>註:圖中 Current Value 的箭頭增減是與上一小時 Value 比較的結果</p></figcaption></figure>

#### Market Pulse 頻道 與 Overall Liquidity 頻道 比較

<figure><img src="/files/Inh7nR8E5JYd7uXGcfHN" alt=""><figcaption></figcaption></figure>

{% hint style="info" %}
**使用須知**

感謝您使用 CoinKarma，本平台提供的數據指標主要基於過去的歷史表現，無法完全預測未來的市場走勢。加密貨幣市場具有高度的波動性，使用者應謹慎評估風險，並為自己的決策負責。
{% endhint %}


# Karma Index 🔥

## 快速上手 Karma Index

說明：Karma Index 是判斷 BTC 週期的相對底部與相對頂部。

使用情境：趨勢行情。

操作訊號：

* Karma Index < 20：買入(做多)；代表 BTC 週期可能的相對底部。
* Karma Index ＞80：賣出(做空)；代表 BTC 週期可能的相對頂部。

<figure><img src="/files/5EhMS6jnrOp0SsuyVNj2" alt=""><figcaption></figcaption></figure>

***

## 什麼是Karma Index

<figure><img src="https://lh7-rt.googleusercontent.com/docsz/AD_4nXdfW1k3F-xWcjG8N70M8EC8qT6G__UWrlSPyAiUzmGMMhrVMKTBqcvvyZoTQ3XCK4SsKOri6_7VT6BO82XChDOxXVmyfT2kstMilU7VFXnUHmCDO1V5jDzRAjE4yBix1CswLBdRzw?key=luLiz2GY4XjFT_nYY-mTIQJp" alt=""><figcaption></figcaption></figure>

在介紹Karma Index之前，我們先聊聊如何在加密貨幣中賺到週期性的錢，想在交易中賺錢，不外乎就是「低買高賣」四個字而已。但是如何定義出「低點」以及「高點」，就是所有交易者不斷在追求的聖杯。\
在整體大趨勢不斷向上的市場，每一輪週期，底部都在漸漸築高。因此，我們這邊界定的低點是「週期底部」，而高點是「週期頂部」。然而，如同「買在無人問津，賣在人聲鼎沸」這句名言，週期底部之所以會成為底部，通常是因為那裡是人性難以克服的拐點，頂部亦然。

所以一個好的指標，除了要能夠具備辨識週期底頂的「週期性」，還需具備明確的買進賣出訊號的「精準性」，CoinKarma 將現貨市場流動性、鏈上數據、場外熱度、交易所流量、合約市場數據量化成綜合性的 Karma Index，用來判斷大週期週期的相對高低點。<br>

## 如何運用 Karma Index

由於Karma Index是一款「週期性」指標，在解讀方面以大週期為主。下文將會針對「週期性」以及「精準性」去梳理 Karma index 的優勢之處

### 大週期：2019-2021年的牛熊週期

&#x20;中間遇到2020 / 3 / 12事件，也沒有將籌碼恐慌拋出，而是穩穩拿到2021年的階段高點。<br>

<figure><img src="https://lh7-rt.googleusercontent.com/docsz/AD_4nXdvqcHCBoD4YXMUluiQFq0PfeXZnGvSov_w2EWAtxJihdMj27KoiUC8ytXKZF54TRkmbkUFHfEpMB-zqOMpo3qIPhK9mkd6o1Y9_qweXBZW7PuvI8QyTUf2mJVwM6riTlOTnXkCeQ?key=luLiz2GY4XjFT_nYY-mTIQJp" alt=""><figcaption></figcaption></figure>

### 週期間：2019-2021年牛熊週期間的加碼機會

B點為Karma index此輪週期間的一個的低點，剛好對應此輪相同Karma index值A點，隨後BTC再次創下新高。復盤看，B點是「519事件」下殺後的盤整尾端，是一個非常好的入場機會。

<figure><img src="https://lh7-rt.googleusercontent.com/docsz/AD_4nXcq_oItOQU8y_K-caPWcfWvw-jAe3DehkjIt7PtiLVui8rOqifOps2iCmLDAFwXQM_R3oM7-EWbaRYRa0o8CtWhcyOtvViItJCGmqxLC1i-c7wjf7z3ENOiJPk2Q_B9j5V3mxAcLw?key=luLiz2GY4XjFT_nYY-mTIQJp" alt=""><figcaption></figcaption></figure>

### 大週期：2022-2024年的牛熊週期

&#x20;2022 / 11 的FTX破產事件，使BTC跌至本輪週期最低16K，而Karma Index也給出了明確的進場訊號，並穩穩的拿至本輪階段高點73K。

<figure><img src="https://lh7-rt.googleusercontent.com/docsz/AD_4nXcVwhkxh0D6Vm1N2Uh20WPWPMCIN3vSlRqmglPSqYTUfiVIQuN2ISX9lAB4bKM5Xi-lkuS7CUGEn0VNamZp-VTeVN8OINUr905bQWNCyF5W2IheIdjEevaYmV23QLmc8ciwR1Bg6A?key=luLiz2GY4XjFT_nYY-mTIQJp" alt=""><figcaption></figcaption></figure>

### 週期間：2022-2024年牛熊週期間的加碼機會

B點為Karma index此輪週期間的一個低點，剛好對應此輪相同Karma index值A點，隨後BTC再次創下新高。復盤看，B點剛好是Q4牛市的起漲點，是一個非常好的入場機會。

<figure><img src="https://lh7-rt.googleusercontent.com/docsz/AD_4nXfBZGMQJVUKmNTT6PJuW31B19G8U-iOBAnJtg2qdb6e451bmHXdT2ZlsgIkSBCxa1hgeKmmj5oYQ-f0ZH79Tk6RTtpuS0yWVFsZVmJ8pB-Ftf82zsDXE1Ko3j-7cuAGFeIAsQeU?key=luLiz2GY4XjFT_nYY-mTIQJp" alt=""><figcaption></figcaption></figure>

#### ●週期性

可以看到圖中的綠色及紅色箭頭，綠色為買進訊號，紅色為賣出訊號。圖中明顯的表現出當買進訊號頻繁出現，歷史上大概率為 global bottom，而賣出訊號頻繁出現，歷史上為 globo top。這數據為 Karma index 帶來有力的「週期性」依據。<br>

#### ●精準性

我們透過與市面上主流的兩款「週期性指標」進行回測比較可以發現Karma Index相較於AHR999、Crypto Greed & Fear提供的買賣訊號，在「精準性」方面展現了顯著的競爭優勢。

<figure><img src="https://lh7-rt.googleusercontent.com/docsz/AD_4nXcfWLETPF3iWErf74cfz1jS_ioEp1ifs6QKPNzLXYW4RT7OqFz6FW_yMQsPpNSREqzyUAU7yJpzYOKQaBlZu-bseRIu6IBQE_lHZE5-h1IAfLJfQZWoLbO8A71IDaraBsSI4Dlsgg?key=luLiz2GY4XjFT_nYY-mTIQJp" alt=""><figcaption><p>(交易策略:每一次買進訊號 → 買入本金 10%;每一次賣出訊號 → 平倉倉位 50%)</p></figcaption></figure>

| <p><br></p> | Karma index | AHR999 | Crypto Greed & Fear |
| ----------- | ----------- | ------ | ------------------- |
| ROI         | 1917.4%     | 478.7% | 54.2%               |
| MDD         | 62.5%       | 35.4%  | 71.5%               |

{% hint style="info" %}
**使用須知**

感謝您使用 CoinKarma，本平台提供的數據指標主要基於過去的歷史表現，無法完全預測未來的市場走勢。加密貨幣市場具有高度的波動性，使用者應謹慎評估風險，並為自己的決策負責。
{% endhint %}

<br>


# Bitfinex Indicators 🔥

## 快速上手 Bitfinex BTCUSD LONGS

說明：Bitfinex BTCUSD LONGS 是 Bitfinex whale 的 BTC 現貨多頭槓桿部位。

使用情境：趨勢行情。

操作訊號：

* Bitfinex BTCUSD LONGS 累積至一定程度，代表 Bitfinex whale 看好後市，亦代表市場後續大概率仍有一波上漲行情。

<figure><img src="/files/e8vbdTXLhf7FjNZto9YQ" alt=""><figcaption></figcaption></figure>

***

## 快速上手 Bitfinex Premium

說明：Bitfinex Premium 是 Bitfinex-BTCUSD 與 Coinbase-BTCUSD 的溢折價關係。

使用情境：震盪行情。

操作訊號：

* Bitfinex Premium > 0.25：買入(做多)；代表 Bitfinex whale 的買方力道強於市場平均。
* Bitfinex Premium < -0.25：賣出(做空)；代表 Bitfinex whale 的賣方力道強於市場平均。

<figure><img src="/files/zIp1z39IxmnarjhD9jgR" alt=""><figcaption></figcaption></figure>

***

## 什麼是 Bitfinex Indicators

<figure><img src="https://lh7-rt.googleusercontent.com/docsz/AD_4nXeJzlqBmPbpOxCdlxCP5SLc8Vruz85u6RCTrd6JdjMxooCo4zLGedzopjSpUggOXm79gZgQCih_Kg2mXCl7EtAV0wDwoggSmE4Qyho366RL01_mw0jGUGOOd7IRfZmeVq7si2mk?key=luLiz2GY4XjFT_nYY-mTIQJp" alt=""><figcaption></figcaption></figure>

### 在介紹 Bitfinex 相關指標之前，我們先簡單了解下 Bitfinex

Bitfinex 是一家歷史悠久的交易所，Bitfinex 隸屬於 iFinex 公司，而 iFinex 同時也是當前市值最大穩定幣 USDT 發行商 Tether 的母公司，經過 CoinKarma 團隊多年的觀察，發現 Bitfinex 上的巨鯨對市場影響力巨大，因此開發了多個追蹤巨鯨行為的指標，藉此來判斷市場的聰明錢如何看待當前市場行情。<br>

## 如何運用 Bitfinex Indicators

以下就 Bitfinex Indicators 的種類分別介紹

### ● Bitfinex BTCUSD LONGS、Bitfinex ETHUSD LONGS

以下以 BTCUSD 舉例

Bitfinex BTCUSD LONGS 是 Bitfinex 上 BTC 現貨槓桿的總頭寸(幣本位)，由於巨鯨資金量體龐大，貿然市價買入/賣出會劇烈造成價格波動，所以建倉通常都是在下跌期間（賣方流動性旺盛）時逆勢吸籌，出貨則是在上漲期間（買方流動性旺盛）時逆勢倒貨。

當市場劇烈下跌時，我們可以觀察 Bitfinex 巨鯨是否有抄底行為。譬如 2022 年熊市，在 BTC 因為 LUNA 崩盤事件跌破 35K 時，巨鯨就開始大規模抄底，一路買到了 16K。但我們要注意的是，當巨鯨剛開始出手時價格往往還不是底部，建倉時間往往會以月為單位，所以我們可以在巨鯨累積部位達到一定程度或倉位增幅斜率加速時再出手，進場價格會比較漂亮。

出貨也是相同邏輯，巨鯨剛開始出貨時都是買方流動性較好的時候，往往是牛市開端，但當部位下降到一定程度就比較危險，譬如在 2024 年 3 月中，我們可以看到巨鯨基本上已經把從 2022 年熊市建立的頭寸出清完畢，當 BTC 觸及最高價 7.3 萬後，迎來了長達半年的寬幅震盪， BTC在 8 月初一度跌破 5 萬，而我們觀察到在 6 萬以下巨鯨又開始積極累積籌碼，直到 2024 Q4 BTC 突破區間後，才開始緩慢下車。<br>

<figure><img src="https://lh7-rt.googleusercontent.com/docsz/AD_4nXf8YUC8AlS74rUErhvNiLg-ToO-IHHXqTgC3I8F8f-NsuOi7kpZt_xvcf1w5Y3iu1_zBns2QY7UqOFuuMb0wFRPuW2X_o4M8vxEefiQdRqd-Bv1iicocvvgR9-gt5I5X3Wyd8YrGw?key=luLiz2GY4XjFT_nYY-mTIQJp" alt=""><figcaption></figcaption></figure>

### ● Bitfinex Margin Long Size

Bitfinex Margin Long Size 是 Bitfinex 交易所槓桿借 USD+USDT 的總倉位規模，當指標越高，代表巨鯨槓桿借幣抄底的倉位規模越大，由於 Bitfinex 的現貨槓桿以 BTC 為大宗，因此這個指標走勢與 BTCUSD LONGS 高度雷同，不過敏感度會比 BTCUSD LONGS 更高。

<figure><img src="https://lh7-rt.googleusercontent.com/docsz/AD_4nXfbC6w8LPlL3hOkE-VkXR6AK33-8k_u3Jpbe24nNHcm8EtE7JSbF_BVe3tbiGTfM5z9GtXR6nqjYS5b4_vpmbbw4K4YJRySFUiB-K7nZ0zwD6tyFCqB7rZHZ-kwwiibhLx4yu_OGQ?key=luLiz2GY4XjFT_nYY-mTIQJp" alt=""><figcaption></figcaption></figure>

### ● Bitfinex Premium

Bitfinex Premium 是 Bitfinex-BTCUSD 相對 Coinbase-BTCUSD 的溢折價關係，當市場情緒低迷，巨鯨左側進場建倉時，此時會造成 Bitfinex 的 BTCUSD 相對 Coinbase 溢價；反之市場情緒高昂，巨鯨慢慢出貨時，此時會造成 Bitfinex BTCUSD 相對  Coinbase 折價，當指標超過閥值，往往就是區間底部或是頂部。以下將+-0.25%標注出來：

<figure><img src="https://lh7-rt.googleusercontent.com/docsz/AD_4nXcFWDL-3CYWhxeV0XSm2yi_HptvlcWD2h2qTvnk3dohHOfRW_8I-7seSc4CAP5kipPdLocxV_BECFPdv9dv3vaEPPHu7Q2wTlQQg1XTPKjMI7L2aNkrYbIZHdH0FPoXa22OunG4Ig?key=luLiz2GY4XjFT_nYY-mTIQJp" alt=""><figcaption></figcaption></figure>

### ● Bitfinex ETH/BTC Whale Indicator

Bitfinex ETH/BTC Whale Indicator 是 Bitfinex ETHBTC Net Longs 槓桿的部位。

當這個指標越高，意味著巨鯨槓桿借 BTC 買入 ETH 的倉位越高。

以下標注處為 Bitfinex 大量建倉 ETHBTC Longs 並平完倉後，對比 ETHBTC 匯率的狀況，可以發現當 Bitfinex 平完倉後，ETHBTC 匯率觸頂機率較高，此時從 ETH 轉倉到 BTC 是較穩妥的選擇。

<figure><img src="https://lh7-rt.googleusercontent.com/docsz/AD_4nXfxO68S7FxY-Ry4Gy8GBvlCileBXW2hZo6uOSI1nwUKP7dmqI5uay1BxXoSOyfUf34Cjzmy5V8DaosKwveKHP0bkENHR53TixIQFLwXgs2yp3Z5v9kcpb_vt8STmrHOxKjd6FmF?key=luLiz2GY4XjFT_nYY-mTIQJp" alt=""><figcaption></figcaption></figure>

## 結語-Bitfinex 指標的適用場景及其侷限性

● Bitfinex 指標的適用場景

Bitfinex 相關指標是屬一款週期性較大的指標，用戶在閱讀指標上建議將週期拉大。<br>

● Bitfinex 指標的侷限性

由於 Bitfinex 巨鯨的持倉週期及建倉幅度都較大，對於散戶在短線上的幫助較小，但用戶依然可以判斷當前市場聰明錢是如何解讀當前市場的；用戶也可以搭配其他 CoinKarma 指標，建構自己的交易策略。

{% hint style="info" %}
**使用須知**

感謝您使用 CoinKarma，本平台提供的數據指標主要基於過去的歷史表現，無法完全預測未來的市場走勢。加密貨幣市場具有高度的波動性，使用者應謹慎評估風險，並為自己的決策負責。
{% endhint %}

<br>


# ALT Resilient Index

## 快速上手 ALT resilient Index

說明：ALT resilient Index 是判斷山寨幣的抗跌程度。

使用情境：行情劇烈下跌時。

操作訊號：

* ALT resilient Index > 3：買入(做多)；代表當 BTC 劇烈下跌時，山寨相對抗跌，通常有較大的概率使行情觸底。

<figure><img src="/files/SiBLse9YhT144Ukc0TSb" alt=""><figcaption></figcaption></figure>

***

## 什麼是 ARI 指標(ALT Resilient Index)

<figure><img src="https://lh7-rt.googleusercontent.com/docsz/AD_4nXerpg0QZQSg9Jn-Zv3k3hg4QnpYdC2imQH9VZ1oIQyCRACN-gnfhDZbdf8IdUw_7rEAoiny_KtdHcrosbmp5FaJjH4lfMpZ7XWNW7MDfQszgdC_ht8gxGGmSxwA4uqjym3vy5J7Kg?key=luLiz2GY4XjFT_nYY-mTIQJp" alt=""><figcaption></figcaption></figure>

在幣圈我們知道一個現象，當 BTC 大跌而山寨幣不跟跌時，通常是短線上一個相對安全的進場邊際，其基礎邏輯是， 當 BTC 下跌時，山寨幣往往會遭到更嚴重的拋售，當行情觸底，山寨幣的造市商會開始回收砸出去的籌碼，此時就會出現 ALT/BTC 匯率反彈的狀況，表現在價格上就是山寨下跌得比 BTC 更少，甚至逆勢反彈。

\
因此透過 ARI 指標可以在 BTC 大跌時，觀察山寨幣造市商對當前極端行情的判斷； 當 ARI 指標數值越高時，代表山寨幣的造市商願意承接市場拋壓的力量越大，換言之，就是造市商願意花真金白銀去護盤，這通常會是行情的止跌點。

## 如何運用 ARI 指標

牛市通常不會是單邊一路漲到尾，而是中間伴隨著 BTC 單邊 10%-20% 以上的跌幅修正； 當行情修正發生時，透過 ARI 指標可以找出安全邊際高的進場位置。&#x20;

● 單以 ARI 指標作為行情介入點&#x20;

以下舉例這輪牛市中，BTC 比較大的單邊跌幅去對比 ARI 指標 &#x20;

◦ A 點：BTC ETF sell the news 事件&#x20;

◦ B 點：以色列—哈瑪斯戰爭加劇&#x20;

◦ C 點：日本央行提高基準利率，引發金融市場崩盤，加劇全球市場動盪&#x20;

這些點位都是受外部因素影響且場內情緒較恐慌的位置，事後單看 ARI 指標都給出了相對低位的進場點。&#x20;

<figure><img src="https://lh7-rt.googleusercontent.com/docsz/AD_4nXeI_XXa4usjytO8bSE2_XJMFxaP0WH3EMNwJFFlA9sxph-2sx8-5XwYRKtvDJqEI4F9-xzLxI0eFmwvvsyx1H0MKEucaSicDwkZuxtyQFBmaIE1Bmy0l2Fdhrz9JT1jS8z11t_frQ?key=luLiz2GY4XjFT_nYY-mTIQJp" alt=""><figcaption></figcaption></figure>

● 將 ARI 作為 LIQ 相關指標進場策略的濾網&#x20;

以下舉例日本央行升息事件：&#x20;

在日本央行 7 月 31 日貨幣無預警升息後，BTC 快速從 67K 跌至 58K 時 LIQ 給出了進場訊號(黃框)，但隨後再次下跌至最低 49K ，若此次我們加上 ARI 指標作為 LIQ 進場的過濾(橘框)，進場的安全邊際會提升非常多。&#x20;

<figure><img src="https://lh7-rt.googleusercontent.com/docsz/AD_4nXeDLQLgY54Qb7tg1K9Ap_8YtSfkoG4qC1ybuHDwHKMZB0CG3RJ8FxVAfSd8K13Z0A59uY5dGdpALZSEaFwNvHe-FirOoR2hHqb_01C5qgOntnTl3T5YfCwQHSv9_6NLrrGbch7nNg?key=luLiz2GY4XjFT_nYY-mTIQJp" alt=""><figcaption></figcaption></figure>

## 結語-ARI(ALT Resilient Index)指標的適用場景及其侷限性&#x20;

● ARI 指標的適用場景&#x20;

當行情發生大幅度修正時，即可透過 ARI 指標找出安全邊際高的進場位置。 <br>

● ARI 指標的侷限性&#x20;

◦ 介入行情的交易機會少：ARI benchmark 設定為3，若單以 ARI 指標作為進場策略，觸發交易的交易機會會相對較少，用戶可以搭配其他指標達到其最大效用。&#x20;

<figure><img src="https://lh7-rt.googleusercontent.com/docsz/AD_4nXePnmVCINOw16K2fUD_8M1hAFYx4p7tiuZ1ee29T9MyFhihq2F22rkXZyvjN5UxmI3_tmhArbMcn6XDoN4I5_6UToprhP0Oe5jAroV_qCeLxv-YBDJD6oCcyhr4-upnBhKYKLR99Q?key=luLiz2GY4XjFT_nYY-mTIQJp" alt=""><figcaption></figcaption></figure>

◦ 無法 100% 標示絕對的低點：當觸發 ARI 指標時，代表造市商願意在此位階承接市場拋壓，但驅動行情的因素很多，當市場某些因素產生的拋壓大於造市商承接的力量時，價格還是有可能繼續探底。 以下舉例：2024/1 BTC sell the news 事件，當觸發 ARI 指標時，BTC 還是向下跌超10%，但事後看仍是一個不錯的進場位置。&#x20;

<figure><img src="https://lh7-rt.googleusercontent.com/docsz/AD_4nXeBH15Pd0IgR3R1-FNe8ciYtNvS30XEunhFhxviIvCgs5GOmmwLYEJMzkwoX1Ntp2GG0eY4CWJOMiiIG_ZOnIC5YP_KGRne1fMCnUtJtr1YLTeF0PIorC8jTVYQ0cELzYwCrPoFQw?key=luLiz2GY4XjFT_nYY-mTIQJp" alt=""><figcaption></figcaption></figure>

{% hint style="info" %}
**使用須知**\
感謝您使用 CoinKarma，本平台提供的數據指標主要基於過去的歷史表現，無法完全預測未來的市場走勢。加密貨幣市場具有高度的波動性，使用者應謹慎評估風險，並為自己的決策負責。
{% endhint %}

<br>


# Future Basis Rolling APY

## 什麼是 Future Basis Rolling APY

<figure><img src="https://lh7-rt.googleusercontent.com/docsz/AD_4nXcjdPzxa-vK-CM3VEruaPpVI9-NE9zcrBooNsjF34QJccitTYW0ZLlke6_9nDdc3iSz9piHfEcow46WlEsj-Co3FGLTNX0U6o0oOhAnZrAAPVrYCgGOHn3tUm3sghHHF7hTHvlV?key=luLiz2GY4XjFT_nYY-mTIQJp" alt=""><figcaption></figcaption></figure>

遠期交割合約跟現貨價格的差距稱為基差，由於幣圈市場情緒長期看漲，大部分幣種的遠期交割合約都有正基差。這就出現了套利機會，假設 BTC 某個交割合約基差為 2%，距離交割還有 30天，那套利者就可以買進現貨並且做空等量的遠期交割合約來套取這 2% 的利差，這可以說是 free money，只要放到放到交割，這 2% 就是穩賺的。

以上述例子來說，換算的年化報酬率就是 2%\*(360/30)=24%，這稱為 Rolling APY，之所以是 Rolling （滾動），是因為這個報酬率會一直隨著交割時間越來越近而不斷改變，因為越接近交割日，遠期合約跟現貨的價差就會越收斂。<br>

## 如何運用 Future Basis Rolling APY

通常期貨市場越樂觀的時候， 市場大部分的人都會做多，這會造成遠期交割合約相對現貨的溢價擴大，Rolling APY 也會隨之上升，所以 Future Basis Rolling APY 跟資金費率(Funding Rate)一樣，可以用來衡量市場情緒。

從過去歷史來看，BTC 最近一個季度合約的 Rolling APY 有著以下意義：

* 0 以下 = 世界末日（2020/3/12大跌期間有出現過）
* 0-5% = 極度恐慌
* 5%-10% = 市場冷靜
* 10%-15% = 市場微熱
* 15%-20% = 市場狂熱
* 20%以上 = FOMO<br>

預設值為（5, 20），用戶可自行透過覆盤調整參數。<br>

## 結語-Future Basis Rolling APY 的侷限性

如同資金費率(Funding Rate)一樣，以往 BTC 現貨 ETF 還沒通過的時候，正規基金要取得 BTC 的曝險相對困難，現在買 ETF 做空合約非常方便，這會壓低了合約跟現貨的價差使數據有所鈍化。因此使用 Rolling APY 判斷市場情緒時，可能需要降低標準，以往 20% 以上屬 FOMO，現階段 Rolling APY 達 15%-20% 可能已經屬於 FOMO 情況。<br>

{% hint style="info" %}
**使用須知**

感謝您使用 CoinKarma，本平台提供的數據指標主要基於過去的歷史表現，無法完全預測未來的市場走勢。加密貨幣市場具有高度的波動性，使用者應謹慎評估風險，並為自己的決策負責。
{% endhint %}

<br>


# OI-Weighted Funding Rate

## 什麼是 OI-Weighted Funding Rate (持倉加權資金費率)

以下以 BTC OI-Weighted Funding Rate 為例

<figure><img src="https://lh7-rt.googleusercontent.com/docsz/AD_4nXcfRoNOwoVujyky-uXV_wJQD5FgElARc-CZeuO1OzlvpMlD_LhzJaqT7GBXJs_1Exn8uxqAJzjAG6l5uCmveKdJtJcKFrm79kJ5aiHAjzG-LNLrb32mT2DuUmXfJkuRUpmImWpxWw?key=luLiz2GY4XjFT_nYY-mTIQJp" alt=""><figcaption></figcaption></figure>

資金費率（Funding rates）是加密貨幣交易所為了保持永續合約價格與標的資產價格之間的平衡而設定的費率。資金費率一般都會是常數(0.01%)，而當溢價高到一定水平，資金費率就會開始調升，由於做多成本提高，這會促使多頭平倉，把永續合約價格壓下來；相反地，如果永續合約低於現貨價格太多，資金費率也會開始由正轉負，這會促使空頭平空，把永續合約價格拉回正常水位。

資金費率由利率以及溢價控制，因此針對溢價去理解資金費率的變化條件：

溢價指數( P) = \[Max(0,衝擊買方出價-價格指數) – Max(0,價格指數-衝擊賣方出價)] / 價格指數

而持倉加權資金費率（OI-Weighted Funding Rate）是依各大交易所的BTC永續合約持倉進行加權計算。<br>

## 如何運用 OI-Weighted Funding Rate

當合約市場趨於樂觀的時候， 市場槓桿做多的情緒旺盛，這會造成永續合約相對現貨的溢價擴大，資金費率(Funding Rate)也會隨之上升

所以 OI-Weighted Funding Rate 跟 Future Basis Rolling APY 一樣，可以用來衡量市場情緒。

### ● 資金費率飆升的狀況（意味著永續合約價格高於現貨價格很多），有可能的情況會是：

1\. 價格處於上漲趨勢，多頭激情開倉，且槓桿較大，拉高了永續合約價格

2\. 價格處於下降趨勢，多頭激進抄底，逆勢扛單，導致永續合約價格相對偏高

無論是哪一個狀況，其實都對多頭較為不利：

1\. 代表市場情緒樂觀，且相較空頭，多頭槓桿倍數較高，更有可能是散戶陣營在開多，更容易翻車

2\. 代表可能有相當規模的多頭倉位即將面臨爆倉或止損的命運，空方佔優

### ● 資金費率下降的狀況（意味著永續合約價格低於現貨價格很多），有可能的情況會是：

1\. 價格處於下跌趨勢，空頭激情開倉，且槓桿較大，拉低了永續合約價格

2\. 價格處於上漲趨勢，空頭激進開空，逆勢扛單，導致永續合約價格相對偏低

無論是哪一個狀況，其實都對空頭較為不利：

1\. 代表市場情緒悲觀，且相較多頭，空頭槓桿倍數較高，更有可能是散戶陣營在開空，更容易翻車

2\. 代表可能有相當規模的空頭倉位即將面臨爆倉或止損的命運，多方佔優<br>

## 結語-OI-Weighted Funding Rate 的侷限性

如同 Future Basis Rolling APY 一樣，以往 BTC 現貨 ETF 還沒通過的時候，正規基金要取得 BTC 的曝險相對困難，現在買 ETF 做空合約非常方便，大量傳統機構入場套利會使資金費率數據有所鈍化。因此現在使用 OI-Weighted Funding Rate 判斷市場情緒時，相較前幾輪週期，基準需要往下移動。

{% hint style="info" %}
**使用須知**

感謝您使用 CoinKarma，本平台提供的數據指標主要基於過去的歷史表現，無法完全預測未來的市場走勢。加密貨幣市場具有高度的波動性，使用者應謹慎評估風險，並為自己的決策負責。
{% endhint %}


# Exchange App iOS Ranking

## 什麼是Exchange App iOS Ranking

iOS App Ranking 是在美國地區中心化交易所的下載量排名。

通常在市場冷清的時候，許多人都漸漸淡出市場，導致關注市場的注意力降低。\
但當市場進入情緒瘋狂的時候，看到許多人賺錢的消息，會使人們趨之若鶩的進入市場，就連擦鞋的小孩都會想找門路進入市場，這就是俗稱的「擦鞋童效應」。<br>

因此透過觀察 Coinbase App 的下載量排名，可以判斷是否有擦鞋童效應的產生，當下載排名進入前幾名時，象徵市場已經非常瘋狂，大家都想找方法進入市場，反之亦然。<br>

## 如何運用Exchange App iOS Ranking

指標的藍線數值為 Coinbase 在美國地區的財經類 APP 熱度排名，因此數值越低代表排名越靠前。當 Coinbase App 排名越高，代表目前美國市場散戶對 Crypto 的 mind share 越高。當排名衝進 Top 10，超越了一些傳統財經類 APP（如盈透證券、Yahoo Finance 等）時，代表行情短線可能過熱，該進場的散戶都進場了。

復盤過往牛市，當 Coinbase 排名長時間都在 Top 10 時，有較高機率為階段性行情的頂部，當排名在高位持續越久，越有機會成為 Global top。下圖以前 10 名作為一個基準，復盤 2021 與 2024 牛市供讀者參考。<br>

<figure><img src="https://lh7-rt.googleusercontent.com/docsz/AD_4nXeNaY__G6Tp_2IKkxrijn-vOyVJd9uL_nV9H2aZvjtyjDYXNyaE3Xn5sCFOPkoM54Rtn9QxYoDlvUm31J0Ny7mxEXvFqKUllafXDDp27ewTKwqskFetlaq4eq9KnMHvqEJMuYpx9w?key=luLiz2GY4XjFT_nYY-mTIQJp" alt=""><figcaption></figcaption></figure>

{% hint style="info" %}
**使用須知**

感謝您使用 CoinKarma，本平台提供的數據指標主要基於過去的歷史表現，無法完全預測未來的市場走勢。加密貨幣市場具有高度的波動性，使用者應謹慎評估風險，並為自己的決策負責。
{% endhint %}

<br>


# USD/USDT Interest Rate

## 什麼是USD/USDT Interest Rate

除了幣圈獨有的永續合約和資金費率外，幣圈依舊有傳統金融常見的借貸利率。借貸利率是中心化交易所上，進行現貨借貸行為所產生的利率。因此有兩個重點可以進行分析，第一個是中心化交易所，第二個就是利率高低。目前中心化交易所採取的依據為目前世界上最大的交易所 Binance 以及以借貸著名的老牌交易所 Bitfinex。

\
●Binance

目前身為世界上最大的交易所，因此裡面的會員組成會相對複雜，且散戶比例會相對較高， 這樣的特性可能導致在市場進入價值發現的階段或是牛市時，大家的行為會普遍比較激進。

●Bitfinex

Bitfinex身為歷史最悠久的交易所及其背景，交易成員有蠻大機率為幣圈原生主力(巨鯨)，因此透過觀察Bitfinex的借貸利率，可以判斷市場所謂的聰明錢是如何判斷當前市場行情。<br>

## 如何運用USD/USDT Interest Rate

USD/USDT Interest Rate屬於一款週期性較大的指標。因兩家交易所的各自特性及成員組成，我們將Binance的借貸行為視為散戶、Bitfinex的借貸行為視為主力。

可以發現

* 當Bitfinex的借貸利率 > Binance的借貸利率，往往是行情底部，
* 當Bitfinex的借貸利率 < Binance的借貸利率，往往是行情頂部。<br>

{% hint style="info" %}
**使用須知**

感謝您使用 CoinKarma，本平台提供的數據指標主要基於過去的歷史表現，無法完全預測未來的市場走勢。加密貨幣市場具有高度的波動性，使用者應謹慎評估風險，並為自己的決策負責。
{% endhint %}

<br>


# Binance Insurance Fund

## 什麼是Binance Insurance Fund(合約風險保障基金)

根據 Binance 的介紹文檔所述：

* 數據解釋：合約風險保障基金是用於限制交易對手強平影響的安全機制，這能保護交易者免受破產倉位所生的不利損失，並有助於確保獲利倉位的收益全額支付予獲利的交易者。
* 基金來源：當倉位遭到強平時，除非該倉位在強平後屬於破產倉位，否則會在扣除用於維持倉位所需的部分資產後，作為強平清算手續費支付給幣安，而此手續費部分分配予合約風險保障基金。

綜上，我們知道永續合約是一個零和市場，有人賺錢就會有人賠錢，而在極端行情下，賠錢的一方的保證金無法足額支付給獲利的一方時，就會由合約風險保障基金來支付，因此在極端清算槓桿的行情之後，合約風險保障基金才會下降。<br>

## 如何運用Binance Insurance Fund

Binance Insurance Fund 長期向上增長，當遇到巨量清算、導致用戶穿倉的行情，才可能使 Insurance Fund 減少，因此當 Binance Insurance Fund 減少時，我們可以判斷短線上已經過度清算，尤其當清算槓桿多頭時，對比此數據特別有奇效，通常會是階段底部。

<figure><img src="https://lh7-rt.googleusercontent.com/docsz/AD_4nXdMe81zmZrN2bueuxc3CCBTA-cZSI229r9i2CfC7OEUSIHhR3yZmbPleMAUT9V9UmVB04I9SnE9rRYhrQJWPwnfgJmPR3QKk-gDdtkofRmcWnwu9zfPi2dO32gJ5cUz7ELEMhSCrQ?key=luLiz2GY4XjFT_nYY-mTIQJp" alt=""><figcaption></figcaption></figure>

{% hint style="info" %}
**使用須知**

感謝您使用 CoinKarma，本平台提供的數據指標主要基於過去的歷史表現，無法完全預測未來的市場走勢。加密貨幣市場具有高度的波動性，使用者應謹慎評估風險，並為自己的決策負責。
{% endhint %}

<br>


# CVD(Cumulative Volume Delta)

## 什麼是CVD(Cumulative Volume Delta)

CVD是一種用來分析市場買賣力量平衡的指標，它累積了在一定時間內買入和賣出訂單的交易量差異。

簡言之，可以把CVD當作一段行情下「市價單」買賣力道的呈現。

<br>

## 為什麼Coinkarma要特別收錄CVD指標？

是因為LIQ的相關指標，皆是基於現貨訂單簿的買單 (bid) 以及賣單 (ask) 即「限價單」所組成，而當一段行情中，「市價單」的力量持續往某一方向推進時，就有可能同時消耗大多數的「限價單」，這會使LIQ相關數據呈現過度延伸。<br>

## 如何運用 CVD

此段的介紹，我們將以LIQ過度延伸的部分去對比CVD，探討如何用CVD去過濾LIQ過度延伸的情況。

以下舉例：Overall LIQ紅柱時的過度延伸，黃框處頻繁出現Overall LIQ紅柱，但是價格卻屢創高點，同時我們觀察到CVD，可以發現這段的市價買盤非常猛烈，這使許多賣單 (ask)「限價單」被消耗，造成Overall LIQ過度延伸。因此可以透過觀察CVD去過濾掉開空的選擇。

<figure><img src="https://lh7-rt.googleusercontent.com/docsz/AD_4nXdPatF0u0S-dyQKBnnSG0Cgmg24sX5SdKZ7fud8VuDQQshzfMRXMWvJAaNzcM6osxW4WPmiHVIC18niqpviBZGlEhaz6CrUm9LmPeLIFvNucab3W9Pb12lKmujhfbdtDmKZ9urQYA?key=luLiz2GY4XjFT_nYY-mTIQJp" alt=""><figcaption></figcaption></figure>

{% hint style="info" %}
**使用須知**

感謝您使用 CoinKarma，本平台提供的數據指標主要基於過去的歷史表現，無法完全預測未來的市場走勢。加密貨幣市場具有高度的波動性，使用者應謹慎評估風險，並為自己的決策負責。
{% endhint %}

<br>


# CME Smart Money

## 什麼是CME Smart Money

在市場上有一些巨鯨，他們的持倉能有一定的程度影響市場，因為當他們願意買進時，就會為市場帶來買方的支撐力道。除此之外，信息落差一直都是在市場上賺錢的根本之一，觀察有機會具備信息落差的鯨魚，就有機會為我們分辨出市場後續可能的趨勢。

在2024年BTC ETF通過的前後，市場都圍繞在此敘事，而當時最方便美國傳統金融交易的交易者交易BTC的地方便是芝加哥期貨交易所 (CME)。

CME Smart Money 是透過篩選在 CME 不同種類的交易員，去選出持倉變化在走勢上有 alpha 的那組人，歸集成的指標。<br>

## 如何運用 CME Smart Money

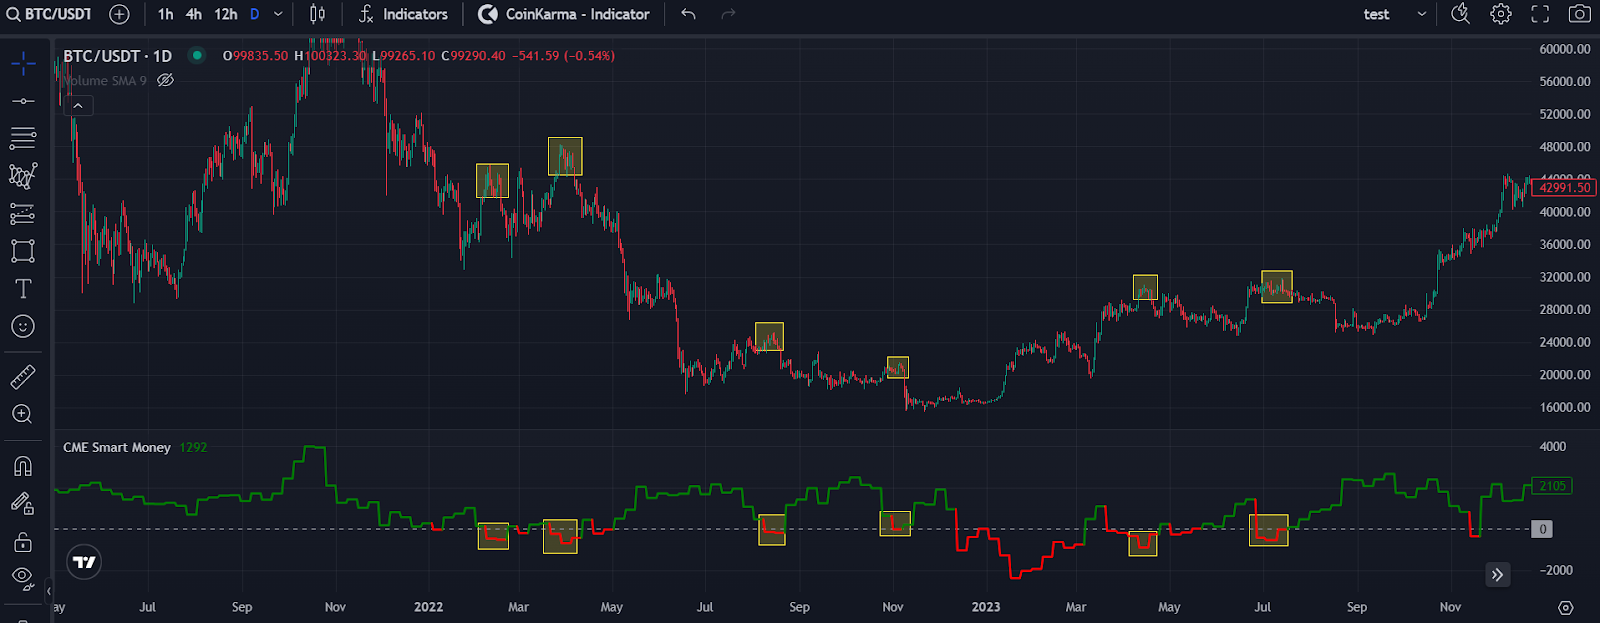
* 單位：張；一張5顆BTC。
* 讀取：０軸以上為淨多頭；0軸以下為淨空頭
* 更新時間：數據更新週期為台北（UTC+8)星期六更新當周星期二的倉位狀況。<br>

2022-2023年每當 CME Smart money 轉 net short 時，通常都是階段高點。

<figure><img src="https://lh7-rt.googleusercontent.com/docsz/AD_4nXcS-6exHBSwlAA1QW7h4zGUSmZbWFgC47FLiSHztRKRwP9_vucCYblpY2XPEMotJzzkVmOfJYo5ts1hs5uGYAcbd9w_5VkgeZa6RYN9VzZmwZb_-VzPJwobbZJih9VnAfnzwZXF?key=luLiz2GY4XjFT_nYY-mTIQJp" alt=""><figcaption></figcaption></figure>

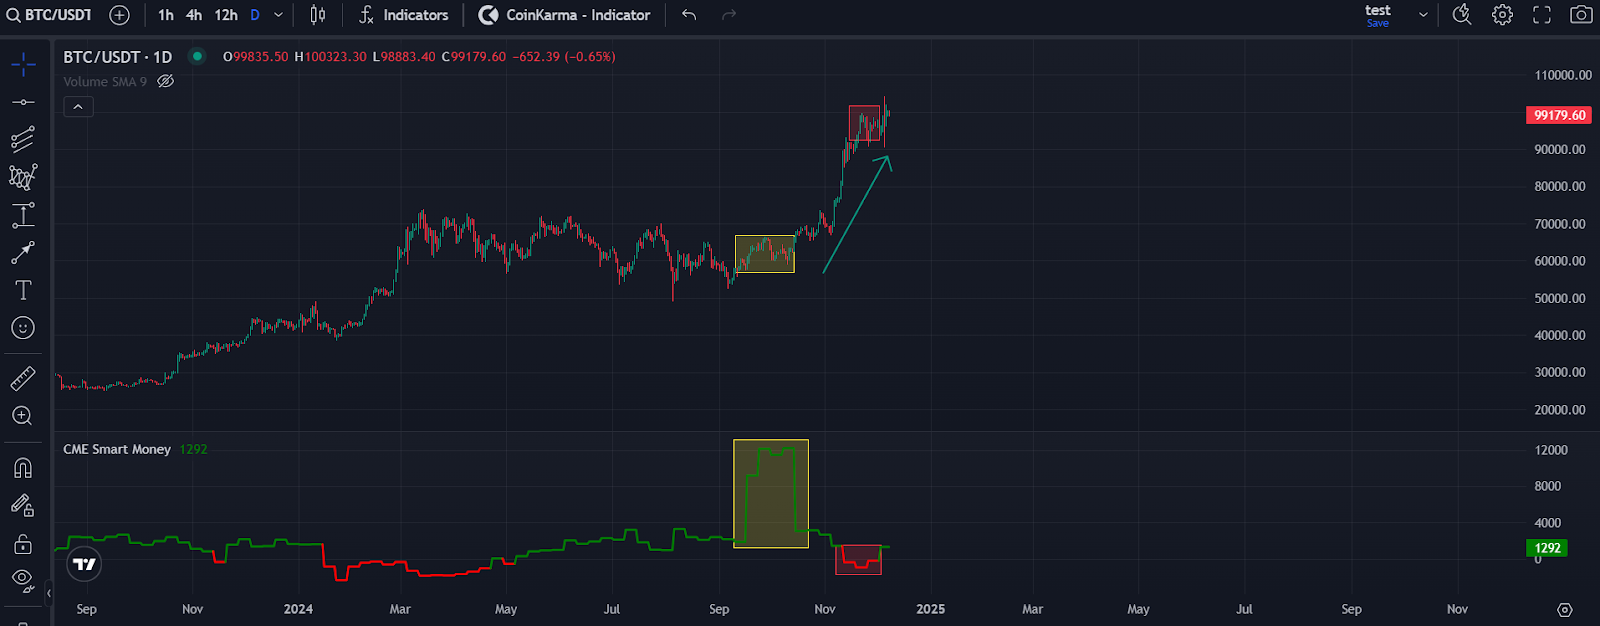
2024 / 10 CME smart money 由1,800張加倉至12,000張，這是有數據以來最大的持倉及加倉幅度，隨後BTC迎來單邊行情突破100K大關。

<figure><img src="https://lh7-rt.googleusercontent.com/docsz/AD_4nXf8nC-K0Fyg60DizkPxYnmFuOebnKbJvNvUDV_CnA9PKbXEXubjF-N0oEkA3sBJTzx8MY6IMLCMUtk00_xEP532s6evU_ao2JRCbiIGk1QPMW7em4emQKGEGf-hUXV1LtcgzVOV4A?key=luLiz2GY4XjFT_nYY-mTIQJp" alt=""><figcaption></figcaption></figure>

{% hint style="info" %}
**使用須知**

感謝您使用 CoinKarma，本平台提供的數據指標主要基於過去的歷史表現，無法完全預測未來的市場走勢。加密貨幣市場具有高度的波動性，使用者應謹慎評估風險，並為自己的決策負責。
{% endhint %}

<br>


# BTC ETF Net Flow

## 什麼是BTC ETF Net Flow

BTC ETF Net Flow 是美股 BTC ETF 的淨流入(出)，CoinKarma 收錄了10支美股 BTC ETF 每日淨流入(出)的數據。

而 CoinKarma 之所以收錄 BTC ETF Net Flow，是因為透過復盤發現， 從 BTC ETF 流入的資金有一部分是套利倉位，對行情影響並不大，與我們直覺上認為 BTC ETF 的淨流入是看漲後市、淨流出是看跌後市的想法，有所不同，我們可以根據 BTC ETF 流入資金的狀況，來判斷期貨市場的情緒。<br>

## 如何運用 BTC ETF Net Flow

以下分析，美股投資人如何透過美股BTC ETF來進行套利：

* 當市場情緒好(過熱)，期貨溢價變高 --> 套利資金買進 BTC ETF，做空 CME 的期貨
* 當市場情緒差(恐慌)，期貨溢價變低 --> 套利資金賣出 BTC ETF，平倉 CME 的空單<br>

所以當每次 BTC 行情到頂的時候， CME 的持倉量都會急遽拉升（對應的是 hedge fund 的 net short position 上升），行情下殺完之後，CME 持倉量也跟著下滑。

這批套利資金無需等到期貨交割才平倉，只要在幣圈市場情緒不斷發散跟收斂的過程中，一直在市場 fomo 時做空，市場恐慌時平空就可以賺錢。

透過觀察，IBIT 因為投資人屬性及手續費優勢，套利資金比較青睞 IBIT，其他 ETF 也有類似的套利行為，但規模遠不及 IBIT。因此我們夠過 IBIT 資金的流入流出狀況對比 BTC 價格，可以發現當 IBIT 資金淨流出或停止流入時（套利空單平倉、賣出 ETF 持倉），幾乎都是短期底部。

<figure><img src="https://lh7-rt.googleusercontent.com/docsz/AD_4nXewZR2WlR7nv3xj-K8BYGorHjvGApk0WlUdA_mQcBxrg-jyvIvgZc34Jcqd7ptrtrEUyqxQXOiT87vn2XmSUviUIlL9ZhykWJCsxGDAujKCASIBwqk-XZNqSVhRXUW9AvlOHPqvUg?key=luLiz2GY4XjFT_nYY-mTIQJp" alt=""><figcaption></figcaption></figure>

{% hint style="info" %}
**使用須知**

感謝您使用 CoinKarma，本平台提供的數據指標主要基於過去的歷史表現，無法完全預測未來的市場走勢。加密貨幣市場具有高度的波動性，使用者應謹慎評估風險，並為自己的決策負責。
{% endhint %}

<br>


# Stablecoin Supply

## 什麼是Stablecoin Supply

Stablecoin Supply 是穩定幣 USDT、USDC 的流通市值指標。

## 如何運用 Stablecoin Supply

#### 以市值最大的穩定幣-USDT對比BTC價格：

* 可以發現在2022年隨著市場下跌，USDT市值也隨之下降 → 資金流出市場，可以預期市場流動性不斷減少
* 而隨著2023-2024年市場開始復甦，USDT市值也隨之上升 → 資金流入市場，可以預期市場流動性不斷增加。

<figure><img src="https://lh7-rt.googleusercontent.com/docsz/AD_4nXepJcCldLtoXiLwYqWpgsHegk4GW8g8aOKrtbLG33-nECvw7hOmtAr7rvxaWte5eQgfGvj6F24u2QGWIsTRexG5rSoiPHudrcm0L7tEIZ3EB7n-6dLzQB7ccXa644mIuaiP9waysQ?key=luLiz2GY4XjFT_nYY-mTIQJp" alt=""><figcaption></figcaption></figure>

#### 重點觀察：USDC逆勢增發

透過復盤發現，USDC 在短線上若出現與價格背離、逆勢增發現象，可能會形成底部。以下舉例：Overall LIQ出現綠柱+USDC增發超10億美金的情況，往往會形成短線上的區間底部。

<figure><img src="https://lh7-rt.googleusercontent.com/docsz/AD_4nXcsbvGJaYjL1JXDvyGe3A_GlDis_J6rI5p3FzDDx8DnHHRaSG0kEQT6sodHXPb6P0gniZtYqSDWkadxBMw9F37H1OBggdhaB3m5qnTu6awt2LicaszU67YKN-AYci-f6njXwvj9hA?key=luLiz2GY4XjFT_nYY-mTIQJp" alt=""><figcaption></figcaption></figure>

{% hint style="info" %}
**使用須知**

感謝您使用 CoinKarma，本平台提供的數據指標主要基於過去的歷史表現，無法完全預測未來的市場走勢。加密貨幣市場具有高度的波動性，使用者應謹慎評估風險，並為自己的決策負責。
{% endhint %}

<br>


# Exchange Balance

## 什麼是 Exchange Balance

Exchange Balance 收錄了以下幾間交易所內 BTC、ETH、USDT、USDC 存量的總和，供大家做交易所存量數據上的參考，後續等累積更多數據，會再做更近一步的復盤：

* Huobi
* Bitget
* Binance
* KuCoin
* [Gate.io](https://gate.io/)
* [Crypto.com](https://crypto.com/)
* Bybit
* OKX
* Bitfinex
* Deribit

{% hint style="info" %}
**使用須知**

感謝您使用 CoinKarma，本平台提供的數據指標主要基於過去的歷史表現，無法完全預測未來的市場走勢。加密貨幣市場具有高度的波動性，使用者應謹慎評估風險，並為自己的決策負責。
{% endhint %}


# LSUR Z Index

## 什麼是 LSUR Z Index

LSUR Z index 是頭部幣種 OI 加權的 LSUR，跟過去 14 天平均值差距幾個標準差，舉例：-2 就是小於 2 個標準差。( 註：LSUR 是永續合約數據中，持倉人數多空比 ) 　

過去，在加密貨幣市場中，當 LSUR 小於 1，代表市場上做空的人多於做多的人，通常反映市場情緒過度悲觀，是價格可能觸底反彈的訊號，因此常被視為短期低點的參考指標。然而，這樣的邏輯在近年已逐漸失效，甚至出現反向變化 —— LSUR 小於 1 時，反而成為短期高點的前兆；至於真正的原因為何不得而知，CoinKarma 猜測，背後的關鍵原因之一，是機構資金的大量進場與對沖策略改變了市場結構。機構投資者與散戶不同，他們在現貨市場持有大量資產時，往往會在期貨市場建立空單進行風險對沖，並非單純看空市場。這使得市場在 LSUR 小於 1 的情況下，並不一定是情緒極度悲觀，而可能只是資金管理與策略性布局的結果。

即使市場結構發生改變，LSUR 仍然具有參考價值，透過 CoinKarma 的獨家算法，依然可以用於判斷市場短期多空可能的方向。

## 如何運用 LSUR Z Index

LSUR Z index 需搭配 CoinKarma 其他指標一起閱讀，以下舉例：

● 搭配 Overall LIQ 加以判斷市場可能的反轉點

在震盪行情中，當 LSUR Z index 與 Overall LIQ 共振時，找出潛在的行情反轉點。

<figure><img src="https://lh7-rt.googleusercontent.com/docsz/AD_4nXeiUAmf97NCa1gCl_ACrqQpjjK7oAA1erinkCVILwnsmJEdZAQNSsoXdXaU6pAz_CkNZghr-_TZuS66-QM7c-L3KvJBYQa86A9lxLMh49GrXLz8SEoCwf9xIGzrm1wamx8fxx0kPw?key=luLiz2GY4XjFT_nYY-mTIQJp" alt=""><figcaption></figcaption></figure>

● 判斷 LIQ 相關指標與 LSUR Z index 可能過度延伸的警訊\
黃框：當 LIQ 相關指標與 LSUR Z index 都出現行情可能回調的情況下，但價格仍然保持強勢，說明此處震盪趨勢中的有效因子正在鈍化，應避免做空。 ( 行情可能正由震盪趨勢轉為單邊趨勢 )

紫框：當 LSUR Z index 出現小於 -2 值時，搭配 LIQ 相關指標可以過濾其訊息，避免單就 LSUR Z index 做空。<br>

<figure><img src="https://lh7-rt.googleusercontent.com/docsz/AD_4nXeXR3hDJmv7QVoxYa_QSB-qZotxhDFoC9k7WMFXVgMu-dHelxpun4lUFYbGQKlKE5PSZj-WofTz3tkOl-2I8SrnrpHx8ktIAdu6u2DevrfX4OKZhyrR_JWMST6_nnjfd2e2awBq?key=luLiz2GY4XjFT_nYY-mTIQJp" alt=""><figcaption></figcaption></figure>

{% hint style="info" %}
**使用須知**

感謝您使用 CoinKarma，本平台提供的數據指標主要基於過去的歷史表現，無法完全預測未來的市場走勢。加密貨幣市場具有高度的波動性，使用者應謹慎評估風險，並為自己的決策負責。
{% endhint %}


# Cumberland USDT Distribution

## 什麼是 Cumberland USDT Distribution

<figure><img src="/files/mTQWuvUvUEZZj2IMORW2" alt=""><figcaption></figcaption></figure>

## 關於 Cumberland 的背景

### 公司背景

* 名稱：Cumberland DRW（簡稱 Cumberland）
* 母公司：隸屬於 DRW Holdings，一家成立於 1992 年、總部位於芝加哥的知名自營交易公司（prop trading firm）。
* 定位：Cumberland 是 DRW 在 加密貨幣領域的交易部門，成立於 2014 年，是最早進入加密市場的機構之一。

### 核心業務

* 場外交易（OTC Trading）\
  為機構、礦工、基金會、家族辦公室等提供大宗加密資產的買賣服務，避免在公開交易所造成滑價與劇烈波動。
* 流動性供應（Liquidity Provision）\
  Cumberland 是加密市場最大的流動性供應商之一，在 Binance、OKX、Coinbase 等交易所均能見到它的身影，扮演「造市商」角色，穩定市場深度。

### 為什麼要監測 Cumberland？

1. Cumberland 是 USDT 最大的中轉站
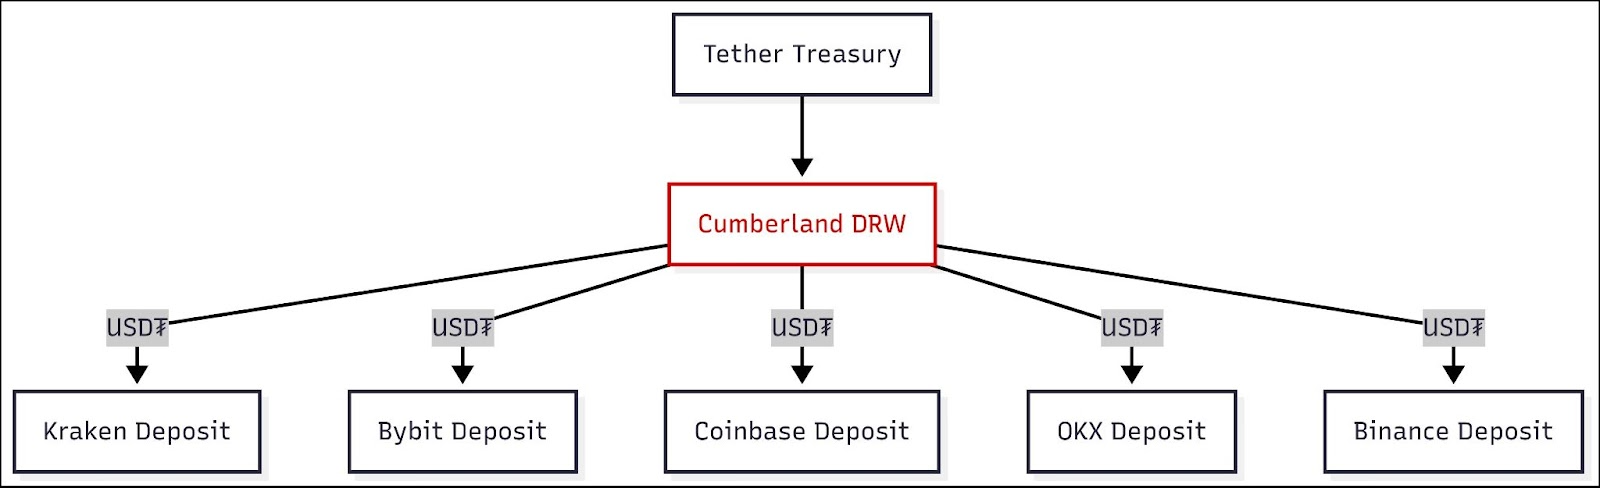
2. Cumberland 是 Tether 金庫（Treasury）的主要合作方，經常承接 USDT 的增發，並將其分流至交易所或機構客戶。
3. 單純的 USDT 增發，並不必然代表資金已流入幣圈，因為部分新增資金可能被用於跨境結算、灰色產業或其他場外交易。CoinKarma 透過追蹤 Cumberland 與 Tether 金庫的交互地址，每小時監測增發資金的實際流向，以判斷這些資金是否真正進入交易所，並對市場形成實際買盤。
4. 與市場行情高度相關
5. 在最近一輪週期中，2024 年初、2024 年末，以及 2025 年中的快速上漲，都可以觀察到 Cumberland 大量將 USDT 注入交易所，為市場帶來顯著的流動性補充。

## 如何運用 Cumberland USDT Distribution

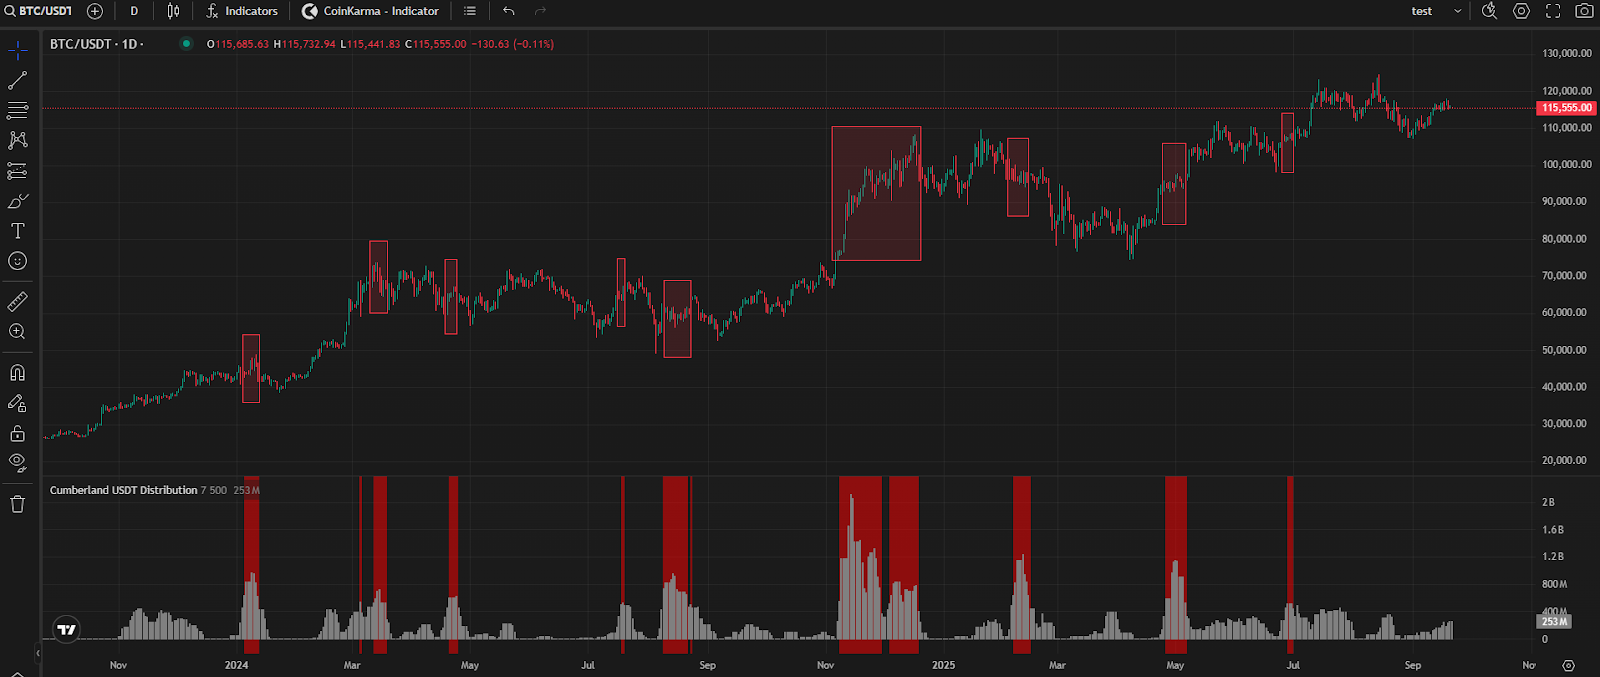
紅框：Cumberland USDT Distribution 7 天累積轉帳超過 5 億美金。\
假設將 USDT 大額鑄幣後轉入交易所，視為未來 1-2 週 taker buy 的力量，那麼紅框（7 天累積轉帳超過 5 億美金）之後的 LIQ 相關指標的紅柱效力將有可能減弱，依此邏輯，可以避開在遇到紅柱過早開空的情況。<br>

以下將搭配 Overall LIQ 進行復盤：

1\. 如圖，切換日線並將 Cumberland USDT Distribution 7 天累積轉帳超過 5 億美金的紅框處 K 線標示出來。

<figure><img src="/files/pKIQTZaOYrQ9QNESi3EI" alt=""><figcaption></figcaption></figure>

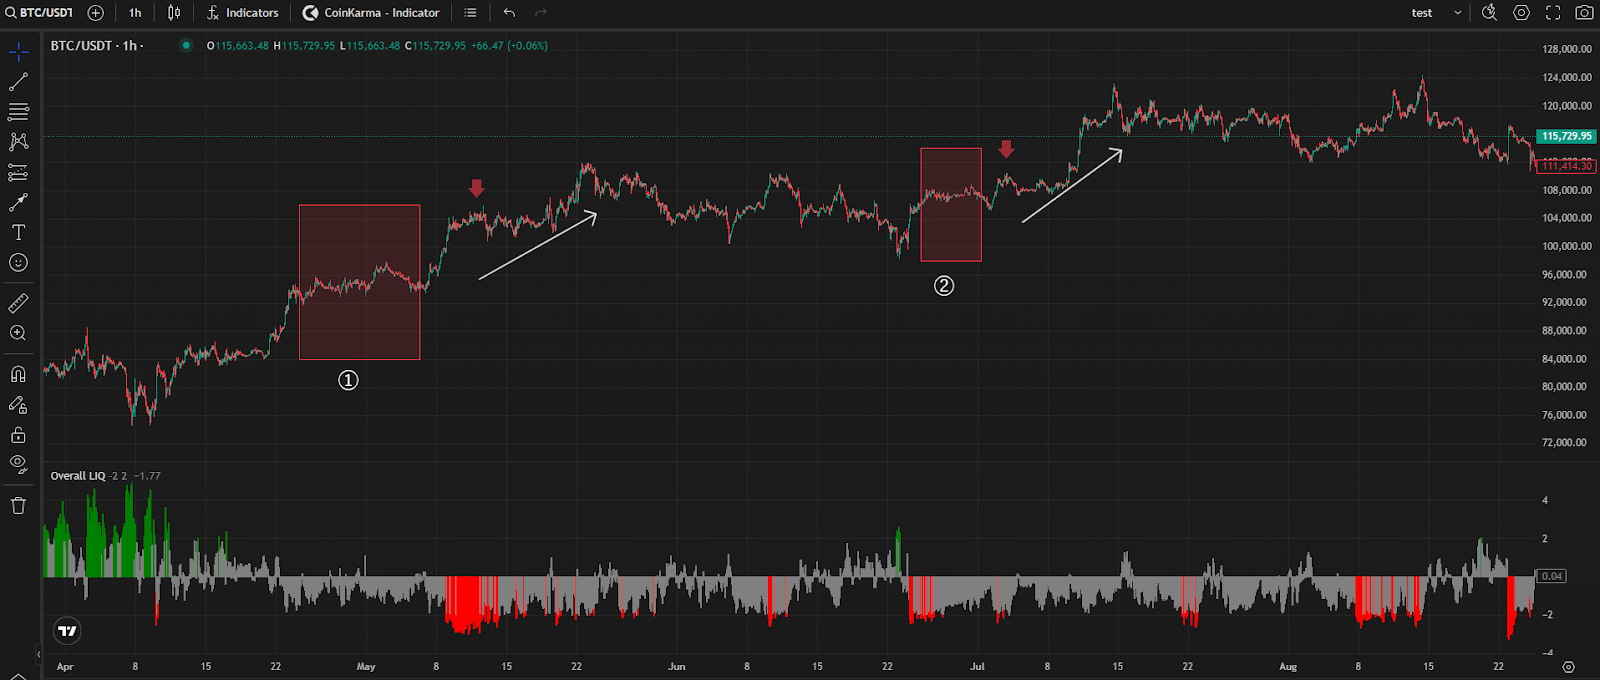
2\. 再切換小時框，對比紅框（7 天累積轉帳超過 5 億美金）之後的 Overall LIQ 紅柱，可以發現 ➀ ➁ 處出現大額 USDT 轉入交易所，隨後行情無視 Overall LIQ 紅柱(紅箭頭處)的壓制，依然強行上漲。

<figure><img src="/files/pCCu2K1tgsP3xJr4Gx96" alt=""><figcaption></figcaption></figure>

## 指標價值

* LIQ 紅柱：在震盪行情中，是相對高準確度的空頭信號。
* 問題：在單邊強勢上漲時，紅柱容易造成「過早開空 → 被嘎」。
* 解法：結合 Cumberland USDT Distribution，能提前辨識「有大額 USDT 流入支撐」的行情，避免誤判。

{% hint style="info" %}
**使用須知**

感謝您使用 CoinKarma，本平台提供的數據指標主要基於過去的歷史表現，無法完全預測未來的市場走勢。加密貨幣市場具有高度的波動性，使用者應謹慎評估風險，並為自己的決策負責。
{% endhint %}


# BTC 25Δ skew

## 什麼是 BTC 25Δ skew

25Δ Skew 反映市場對於看跌期權（Put）與看漲期權（Call）在相同 Delta 條件下的隱含波動率差異：

<figure><img src="/files/fGVkbYjzphJJeEIHpPRU" alt=""><figcaption></figcaption></figure>

其中：

* IV（Implied Volatility）：期權價格反映的市場預期波動。
* ATM（At-The-Money）：平值期權的隱含波動率，用於標準化比較。<br>

### 📘 為什麼用 25Δ

「25Δ」代表期權的 Delta 約為 ±0.25，\
即距離現價一段距離的「虛值期權」(Out-of-the-money)。

* 25Δ Put：距現價略低，反映市場對「下跌避險需求」。
* 25Δ Call：距現價略高，反映市場對「上漲押注意願」。

透過比較這兩者的 IV，可以觀察市場對未來漲跌方向的偏好。

### 📊 如何解讀 BTC 25Δ Skew

| Skew 值 | 意涵               | 市場情緒           |
| ------ | ---------------- | -------------- |
| > 0    | Put IV > Call IV | 市場恐懼、避險需求強（偏空） |
| < 0    | Call IV > Put IV | 市場樂觀、追漲意願強（偏多） |

#### 極端情緒區間（以 1M 期權為例）

<figure><img src="/files/yQq1kOqBiOZbjnXQKDDm" alt=""><figcaption></figcaption></figure>

### 📈 BTC 25Δ Skew 實戰解讀

**Skew < -8 → 市場極度樂觀（Call 看漲情緒過熱）**

* 當 Call 隱含波動率顯著高於 Put，代表市場普遍押注上漲。\
  在上圖中可見 2024 年 12 月，BTC 在短期內大幅拉升，Skew 多次低於 -8，顯示市場情緒亢奮。
* 通常此階段為短線風險偏高區，情緒過熱後容易出現回調。<br>

**Skew > +8 → 市場極度恐懼（Put 避險需求強烈）**

* 當 Put 隱含波動率遠高於 Call，代表市場集中避險、恐懼升溫。\
  在上圖中可見 2025 年 4 月初（川普撤稅消息階段），Skew 多次高於 +8，市場避險需求急升。
* 這類時期常是短線情緒底部區，但需結合價格結構確認反轉。

備註：Crypto 市場的情緒極端可長時間延續：

樂觀階段 Skew 維持低於 -8 並不一定立即反轉，反之亦然。因此，Skew 不應單獨作為交易訊號，而應用來輔助判斷整體市場情緒溫度。

## 如何運用 BTC 25Δ skew

BTC 25Δ Skew 能夠反映市場對未來的樂觀預期或避險需求，是判斷市場情緒的重要輔助指標。

當市場恐懼或貪婪至一定程度時，Skew 的變化往往先於價格出現轉折。<br>

#### **Skew = IV(Put) − IV(Call)**

• Skew 為正：多數人買入 Put 避險，Put 價格較貴 → 市場情緒較恐懼

Skew 為正時，代表多數人正在買入 Put 避險，看跌情緒高漲，然而，市場常因為恐慌情緒過度集中，價格反而容易出現反彈或築底。

• Skew 為負：多數人買入 Call 押漲，Call 價格較貴 → 市場情緒較樂觀

Skew 為負時，代表多數人正在買入 Call 押漲，看漲情緒高漲，然而，市場常因為市場過於樂觀，價格往往形成區間頂部或出現回調。

## 總結 BTC 25Δ Skew 的運用說明

<table><thead><tr><th width="125.375">Skew 值</th><th width="247.109375">意涵</th><th width="160.12890625">極端閾值</th><th>意涵</th></tr></thead><tbody><tr><td>Skew > 0</td><td>Put 較高，整體市場恐懼看跌</td><td>Skew > 8</td><td>市場極度恐懼</td></tr><tr><td>Skew &#x3C; 0</td><td>Call 較高，整體市場樂觀看漲</td><td>Skew &#x3C; -8</td><td>市場極度樂觀</td></tr></tbody></table>

\
Time Period 基準設定為 = 1M\
→ Time Period 是「觀察期權期限結構的跨度」—— 也就是拿多短期的期權或多長期的期權來比較。

舉例：

* 1 天期的期權（超短） → 對突發事件極度敏感，反映「立即恐懼或貪婪」。
* 1 年期的期權（長期） → 反映市場對長期趨勢的穩定預期。<br>

## 結語 - BTC 25Δ skew 的侷限性

BTC 25Δ skew 反映的是「市場情緒」，而非絕對的買賣信號，當 Skew 出現極端值時，結合其他指標相互搭配，能更準確抓住市場的行情拐點。

{% hint style="info" %}
**使用須知**

感謝您使用 CoinKarma，本平台提供的數據指標主要基於過去的歷史表現，無法完全預測未來的市場走勢。加密貨幣市場具有高度的波動性，使用者應謹慎評估風險，並為自己的決策負責。
{% endhint %}


# Volatility Term Structure

## 什麼是 Volatility Term Structure

Volatility Term Structure 是指不同到期時間（Tenor）的期權，其平值隱含波動率（ATM IV） 之間的關係。簡單來說，就是比較短期、中期、長期平值期權的波動率高低，用來觀察市場對未來波動的預期變化。<br>

### 正常與倒掛結構

在正常情況下：

* 長期 ATM IV > 短期 ATM IV
* 因為時間越長，潛在不確定性越大，市場對遠期波動的預期也越高。

但有時會出現「倒掛」：

* 短期 ATM IV > 長期 ATM IV
* 這代表市場在短期內預期會有劇烈波動，通常出現在市場極端情緒（如崩跌前或底部反轉前）。

### 隱含波動率（Implied Volatility, IV）補充說明

在期權市場中，IV 代表市場對「未來價格波動幅度」的預期。\
它反映了市場參與者對標的資產未來不確定性的看法：

* IV 高 → 市場預期劇烈波動、不確定性高
* IV 低 → 市場預期平靜、波動有限<br>

其中最常被觀察的，就是 ATM IV，即「平值期權的隱含波動率」，因為它最能代表市場對未來波動的整體預期。<br>

### 如何運用 Volatility Term Structure

Volatility Term Structure 通常比較以下三個 ATM Volatility 時框：

* 短期：1 month Volatility
* 中期：3 months Volatility
* 長期：6 months Volatility

#### 主要組合

| 組合                | 情況   | 市場狀態解讀          | 波動預期                             |
| ----------------- | ---- | --------------- | -------------------------------- |
| 組合 ① 1M < 3M < 6M | 正常情況 | 市場穩定，長期不確定性高於短期 | 預期波動平穩                           |
| 組合 ② 1M > 3M > 6M | 完全倒掛 | 市場短期內，預期會有劇烈波動  | <p>預期短期波動劇烈；<br>常見於崩跌前或底部反轉前</p> |
| 組合 ③ 1M ≈ 3M ≈ 6M | 完全平坦 | 市場缺乏明確方向，等待事件驅動 | 通常為波動爆發前的靜止期                     |

#### 復盤解析

<figure><img src="/files/uytEOoNlpJ8ZtnL2snj0" alt=""><figcaption></figcaption></figure>

從圖中可見，當橘線（1M ATM IV）向上穿越 藍線、紫線（3M、6M ATM IV）形成倒掛時，\
Volatility Term Structure 區域會顯示紅色標註，這些時期往往對應 BTC 市場即將進入劇烈波動階段。

* 當 BTC 上漲趨勢中出現倒掛 → 容易反轉下跌或進入震盪
* 當 BTC 下跌趨勢中出現倒掛 → 容易反轉上漲或進入震盪整理<br>

黃框處代表倒掛區域，顯示短期 ATM IV 飆升反映避險需求上升，隨後行情往往出現明顯方向變化。\
而當倒掛結束、結構恢復正常（1M ATM IV 再度低於 3M、6M）時，波動率下降，價格趨於盤整。

### 結語：Volatility Term Structure 的侷限性

Volatility Term Structure 能有效捕捉市場「波動預期」的變化，但需注意它 不具方向性。倒掛的出現僅顯示市場短期內預期波動加劇，並不能直接判斷價格將上漲或下跌。因此，實務上常需搭配其他指標（如情緒指標、流動性指標或期權 Skew）進行交叉驗證。

{% hint style="info" %}
**使用須知**

感謝您使用 CoinKarma，本平台提供的數據指標主要基於過去的歷史表現，無法完全預測未來的市場走勢。加密貨幣市場具有高度的波動性，使用者應謹慎評估風險，並為自己的決策負責。
{% endhint %}


# Short Filter

## 什麼是 Short filter

當 Market Pulse Index 達做空值時，但 Cumberland USDT Distribution 近 7 天 USDT 累積轉帳量超過 10% overall liquidity( in USD )，會觸發「No-Short Filter」。

## 如何運用 Short filter

Short Filter 是為了避免在單邊上漲行情中去做空的濾網指標( 如圖中 ❌ 處 )，可能會錯失一些做空的盈利機會，但能有效避免如圖中 A 點、B 點，過早做空而被嘎空的情況，而往往在觸發「No-Short Filter」後，後續仍有較佳的做空機會( 如圖中橘色箭頭處 )。

<figure><img src="/files/v3QK6HrdflnkqzPAdHah" alt=""><figcaption></figcaption></figure>

{% hint style="info" %}
**使用須知**

感謝您使用 CoinKarma，本平台提供的數據指標主要基於過去的歷史表現，無法完全預測未來的市場走勢。加密貨幣市場具有高度的波動性，使用者應謹慎評估風險，並為自己的決策負責。
{% endhint %}


# USDC/USDT Premium

## 什麼是 USDC/USDT Premium

\
USDC/USDT Premium 是衡量 USDC 相對於 USDT 價差的指標。雖然兩者都標榜與1美元掛鉤，但在實際交易中，價格會因市場需求差異與資金壓力出現折溢價，而兩者的價差關係，可用來判斷短線資金的流向與市場承壓方向，其與 BTC 的短期價格波動具有高度相關性。<br>

在沒有外部增量資金進入的情況下，市場主要由場內既有資金循環，而 USDT 是加密貨幣整體市場的主要結算單位，其交易量與深度長期佔比都是遠超過 USDC 的，因此 BTC/USDT 相較 BTC/USDC ，前者才是短線真正決定價格方向的基準價格。

\
所以，當主力在短線上有誘因要賣出 BTC 時，會從流動性較高的 BTC/USDT 開始，這會造成 BTC/USDT< BTC/USDC 的現象 ，因前者主動承壓(買入則相反)，此時套利空間也隨之出現，套利資金會在 BTC/USDT 買入價格較低的 BTC，在 BTC/USDC 賣出價格較高的 BTC，再將獲取的 USDC 拋售換回 USDT，完成套利，所以當 USDC/USDT Premium 低於 0 時，通常代表驅動市場的主要資金正在賣出 BTC。\
\
綜合以上的邏輯整理，以 USDC/USDT Premium < 0 為例：<br>

1. 大資金在 BTC/USDT 拋售 → BTC/USDT 價格領跌
2. 造成 BTC/USDT < BTC/USDC 的現象 → 出現套利機會
3. 套利資金介入－在價格較低的 BTC/USDT 購買 BTC，並於價格較貴的 BTC/USDC 出售 BTC
4. 套利者最後將獲取的 USDC 拋售回 USDT → 導致 USDC/USDT < 0&#x20;

因此 USDC/USDT Premium < 0 通常代表市場大資金在賣 BTC。

## 如何運用 USDC/USDT Premium

以 USDC/USDT Premium < 0 舉例，在沒有外部增量資金進入的情況下，每當 USDC/USDT Premium 轉負時，通常短線上會出現觸頂現象。

<figure><img src="/files/fGk6slNAfRVNceXO8lL1" alt=""><figcaption></figcaption></figure>

{% hint style="info" %}
**使用須知**\
\
感謝您使用 CoinKarma，本平台提供的數據指標主要基於過去的歷史表現，無法完全預測未來的市場走勢。加密貨幣市場具有高度的波動性，使用者應謹慎評估風險，並為自己的決策負責。
{% endhint %}


# Custom Signal

## 什麼是Custom Signal

如圖所示，Custom Signal 可以自定義出現箭頭的條件在圖表上。

<figure><img src="https://lh7-rt.googleusercontent.com/docsz/AD_4nXebtF2ddyNsXMsrUIL-5dbS-5EdOhlKAT67kPypKYEiMhvaN_Hccwg2lLMyBep7z03ffhx30Iz0EoyjKCX1bqWCUJW4kYyTg-3sX_hgZ6iDs0r3UJEXpmXks1PJmZRU2XGVBCNTfw?key=luLiz2GY4XjFT_nYY-mTIQJp" alt=""><figcaption></figcaption></figure>

## 如何設定Custom Signal

1.於 CoinKarma - 指標選取 Custom Signal。

2.點選齒輪可自定義出現箭頭的條件。

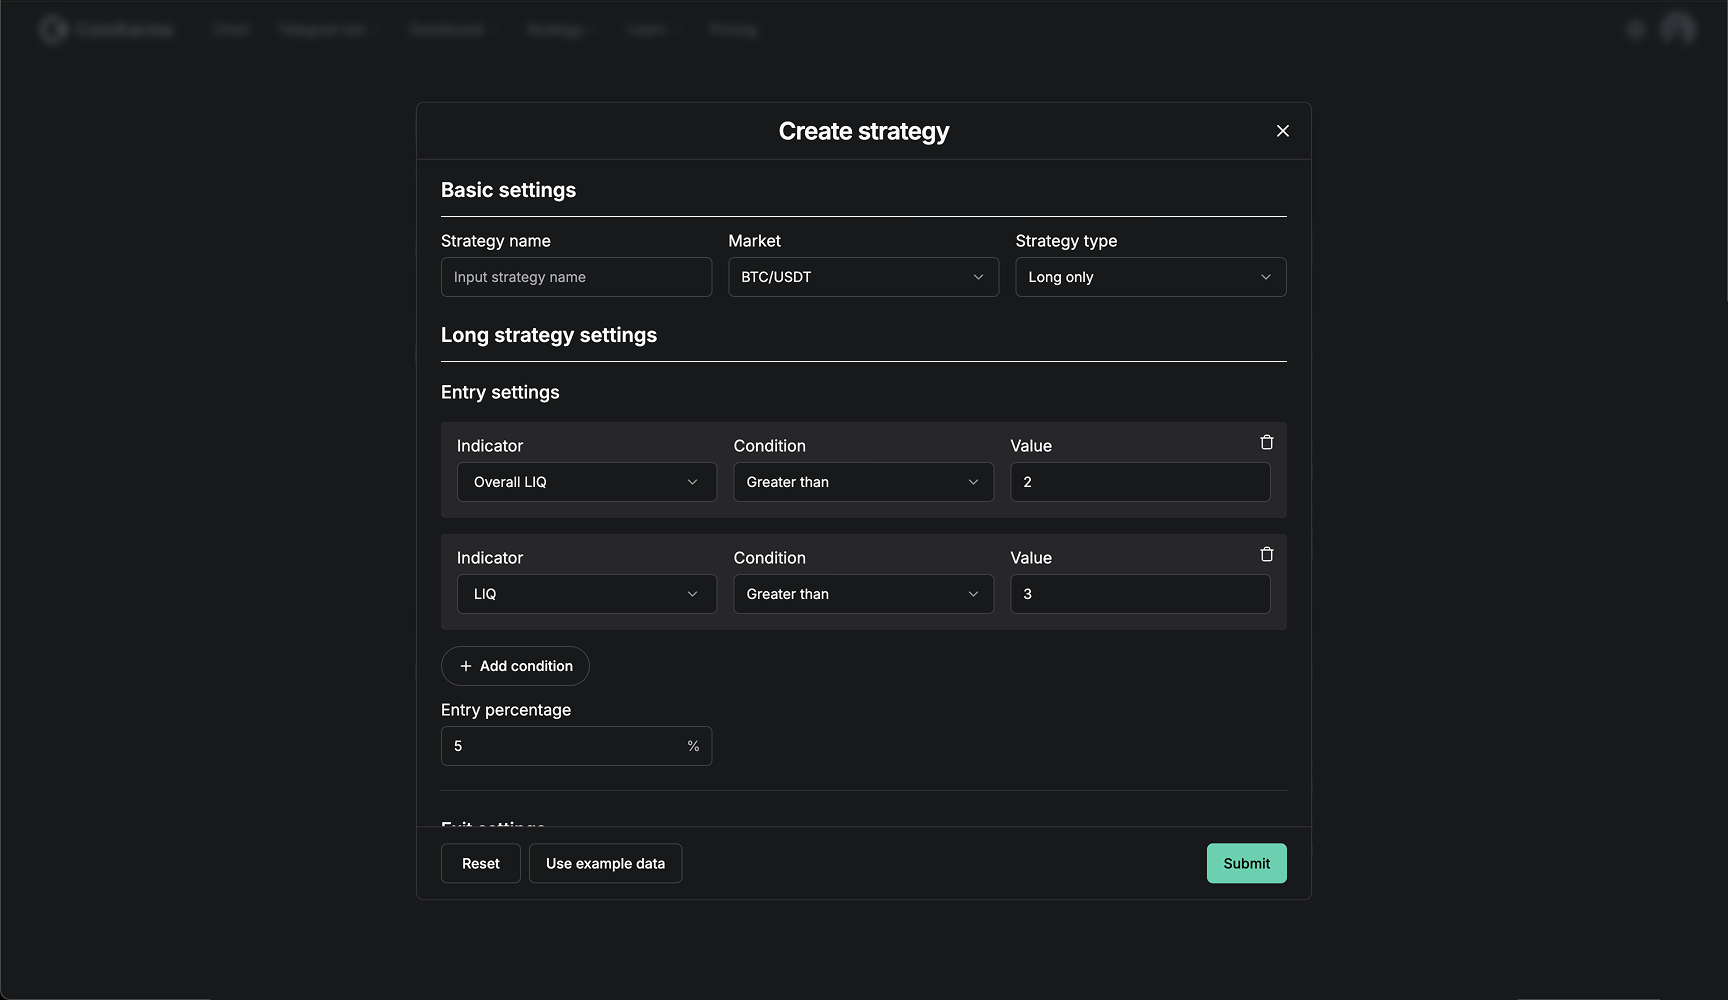
<figure><img src="https://lh7-rt.googleusercontent.com/docsz/AD_4nXe-Ef_j76-DS8D_3wM4X5SKoyAkZKIhq-XM7IqiNTeYZ0hdVe1AQXzgXfExI6u3fXjT5BD-fOWcAzj5V_riV9diJL6Inmf94g0R5EbjaoBZLvUJSx8ekaNgMUZTv3V59in_xh1LHQ?key=luLiz2GY4XjFT_nYY-mTIQJp" alt=""><figcaption><p>預設值為 Overall LIQ(2,-2) + LIQ(3,-3)</p></figcaption></figure>


# Custom Alerts

## 什麼是 Custom Alerts

Custom Alerts 可以設置快訊通知，當指標達到自定義的閥值，系統會觸發快訊到 Telegram Bot，方便用戶偵測指標動態。

<figure><img src="https://lh7-rt.googleusercontent.com/docsz/AD_4nXc1CCiPocL7yxPK2oFPRFLwMoVz2sLjmt7p-XxmaAOR0T12pFK0t_AShNNe5jz-o5jMhKFKJybtYaWjSxJLzi2AYHLVAaREmFb7TnlXX3gXI7lX5i362BZrnIrJH7YeQvh5Cu64wA?key=luLiz2GY4XjFT_nYY-mTIQJp" alt=""><figcaption></figcaption></figure>

## 如何設定 Custom Alerts

1\. 首先，完成 Telegram 帳戶的連結

<figure><img src="https://lh7-rt.googleusercontent.com/docsz/AD_4nXctkvbvW1vLqzOgm7TlObIBJwvwTFKFldtB9TIOAR01MvKRTbxwsjyNTGexX7qHP9RcF6uIv_15lpgizNSYh64QWo70RGAYNv_erfZzDBcMpzWitosBEQY1jTf1UvN57HoOVNKG?key=luLiz2GY4XjFT_nYY-mTIQJp" alt=""><figcaption></figcaption></figure>

2\. 連結 Telegram 帳戶後，即可至設定中添加自定義出現快訊的條件。

<figure><img src="https://lh7-rt.googleusercontent.com/docsz/AD_4nXfjD_aAiwcILcmtfgzruddRO0zlAHvrXS_BsK-ooB9MttubKQOarwPwUfgQ7taAYO_PyWUqDV9e8cGrBm9JTZDBcn2nEw1RXZL_qnMY6kIETfZP1ByVDJM0TaG5AwyZZDKMYwsI?key=luLiz2GY4XjFT_nYY-mTIQJp" alt=""><figcaption></figcaption></figure>

<br>


# Token Screener（山寨幣篩選器）

## 什麼是 Token Screener（山寨幣篩選器）

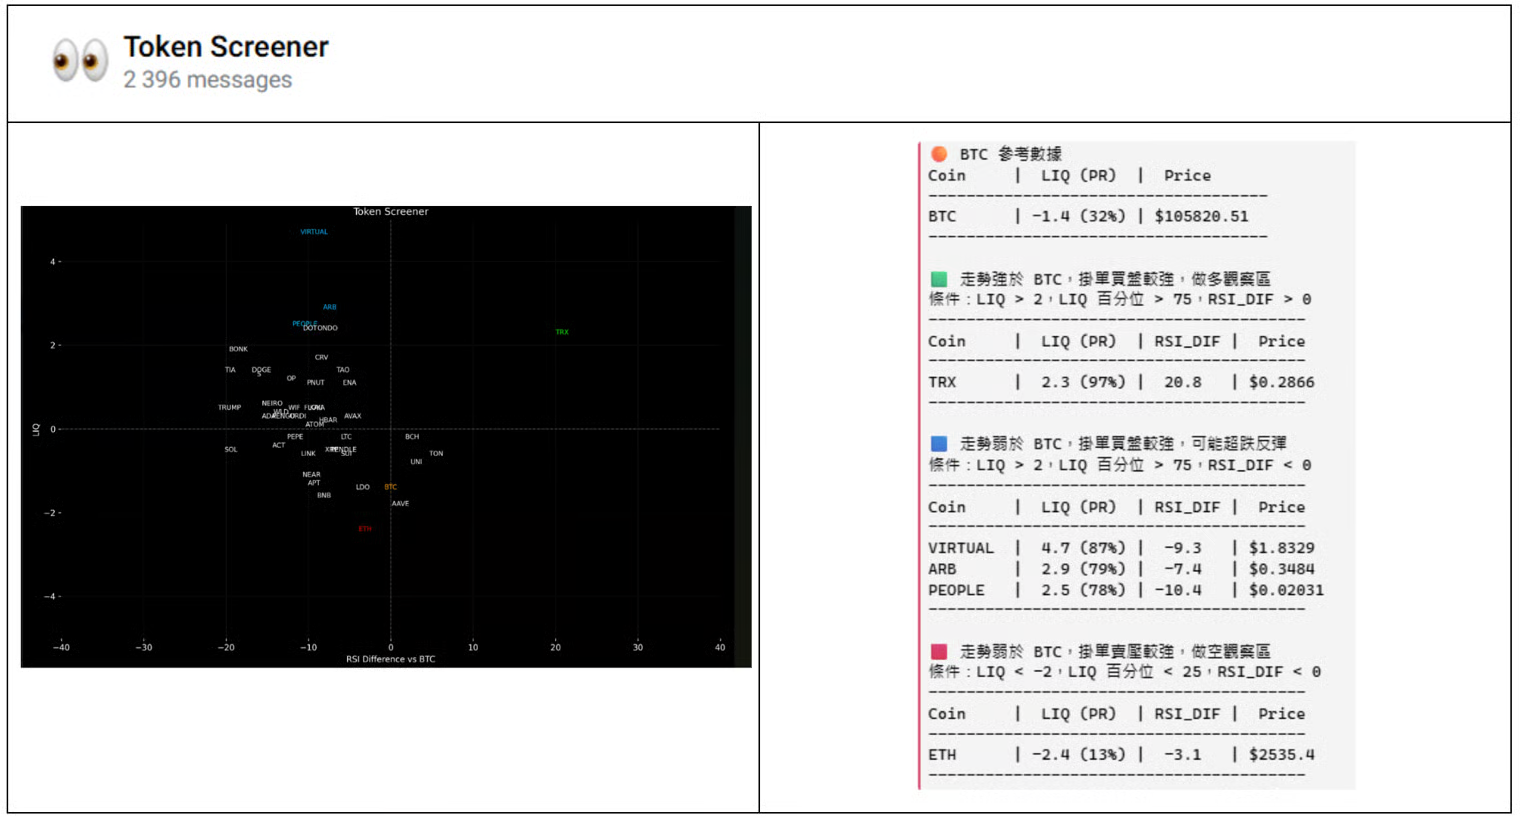
Token Screener 為會員專屬頻道，每小時播報

<figure><img src="/files/VhCOdMYAiox58AT8CxBa" alt=""><figcaption></figcaption></figure>

這個頻道將所有幣種依象限分為四類，並根據條件達成與否以顏色區分；未達條件的幣種顯示為白色，而 BTC 則固定以橘色標示在象限圖上。

<figure><img src="/files/dnQ31WsaNnRcgV2nT8rb" alt=""><figcaption></figcaption></figure>

註１：RSI\_Dif = 跟 BTC RSI 相減的值：正值 = 較強；負值 = 較弱

註２：LIQ百分位 = 該幣種的 LIQ 在過去一個月的百分位數

## 如何運用 Token Screener

可以透過 Token Screener 頻道快速篩選出強勢幣種( 第一象限 )及弱勢幣種( 第三象限 )。

但即使篩選出強(弱)勢幣種，也須加以判斷整體大盤( 即 BTC，以下稱 BTC )的數據表現是否支持；在幣圈，目前各個山寨幣與 BTC 的價格連動性依舊非常強；即便某一個山寨幣本身的數據表現優異，但此時 BTC 價格走弱或整體市場數據偏空，該山寨幣的表現通常仍會受到壓制，難以獨自上漲，其主要原因為：許多山寨幣的交易對以 BTC 為基準(ALTs/BTC)，因此即便 ALTs 對美元穩定，但 BTC 下跌時，ALTs/BTC 的表現仍可能不佳。

\
因此，在判斷山寨幣時，單看其各別數據是不夠的，還必須綜合考量 BTC 的整體數據。

## 具體操作

1. 透過 Token Screener 快速篩選強勢幣種、弱勢幣種 。
2. 觀察 Token Screener 的圖表中，BTC 處於 Y 軸 的何處；

* BTC 處於 Y 軸 越上方：圖表上的強勢幣種效力越強。
* BTC 處於 Y 軸 越下方：圖表上的弱勢幣種效力越強。

● 以下舉例：強勢幣種 及 弱勢幣種 的判別運用 &#x20;

* 強勢幣種( 2025/04/07 15:00 ) - $SUI

於 Token Screener 強勢幣種名單出現，並透過 Custom Signal 發現整體市場流動性數據支持 ( 綠色箭頭 )，後續 $SUI 走出驚人漲幅，大幅跑贏 $BTC。

<figure><img src="/files/yl13YWUBNEouwfYlmFZB" alt=""><figcaption></figcaption></figure>

* 強勢幣種( 2025/04/07 15:00 ) - $DOGE

於 Token Screener 強勢幣種名單出現，並透過 Custom Signal 發現整體市場流動性數據支持 ( 綠色箭頭 )，後續 $DOGE 走出驚人漲幅，大幅跑贏 $BTC。

<figure><img src="/files/6zgZu9Z4w47TQkq3IwLn" alt=""><figcaption></figcaption></figure>

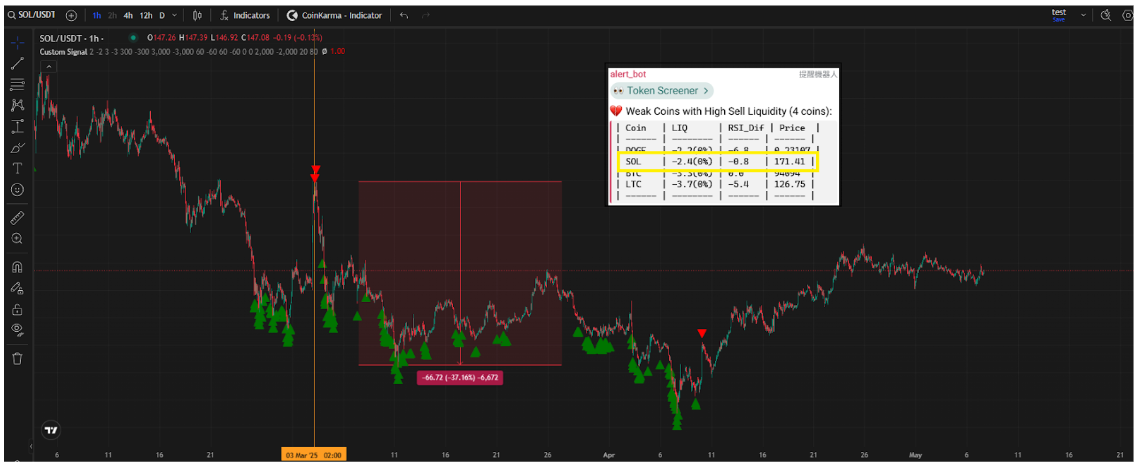
* 弱勢幣種( 2025/03/03 02:00 ) - $SOL

於 Token Screener 弱勢幣種名單出現，並透過 Custom Signal 發現整體市場流動性數據支持 ( 紅色箭頭 )，後續 $SOL 出現大幅回調，跌幅超過 $BTC。

<figure><img src="/files/GOiGJ3xcGVvGP00zQ1Vd" alt=""><figcaption></figcaption></figure>

* 弱勢幣種( 2025/03/03 02:00 ) - $LTC

於 Token Screener 弱勢幣種名單出現，並透過 Custom Signal 發現整體市場流動性數據支持 ( 紅色箭頭 )，後續 $LTC 出現大幅回調，跌幅超過 $BTC。

<figure><img src="/files/ckUIy0uTT3pq5gPfsbZ4" alt=""><figcaption></figcaption></figure>

{% hint style="info" %}
**使用須知**

感謝您使用 CoinKarma，本平台提供的數據指標主要基於過去的歷史表現，無法完全預測未來的市場走勢。加密貨幣市場具有高度的波動性，使用者應盡慎評估風險，並為自己的決策負責。
{% endhint %}


# Strategy Builder

## 什麼是Strategy Builder

Strategy Builder 是 CoinKarma 的回測工具，用戶可以自行設定各種參數去進行回測，後續可將自行設定的策略部署至 OKX 平台進行自動化交易（此功能仍在開發中，目前僅上線回測工具）。

<figure><img src="https://lh7-rt.googleusercontent.com/docsz/AD_4nXfi6FCBMOncfQ4d7lamE7izTcjBTX1fCiJPEYcYRw6eYaFsPFJKH3FRZo8hZwRMmilGuqV4ax0VHGXmnsH9Lf23l561wErgdtvQZsRQLyjiDbKoHaW0fy-U2u_ehwD-ytpBazV4?key=luLiz2GY4XjFT_nYY-mTIQJp" alt=""><figcaption></figcaption></figure>

## 如何設定Strategy Builder

<figure><img src="https://lh7-rt.googleusercontent.com/docsz/AD_4nXcfJ3x9Q7R70tSegukazsstsH0bTERkXL5BQOjLNeJkN2pj0ZtovLJ_FDxQk3BrCb4n8kYuieBo0gRXl44FInEiQS74bs-KtOXxTLLS5jbtQoW2gR-W2JrJ_cF-MhsErWs9kgLbVg?key=luLiz2GY4XjFT_nYY-mTIQJp" alt=""><figcaption></figcaption></figure>

用戶可至策略編輯器-建立回測，回測後會提供相關回測數據供用戶參考。

<figure><img src="https://lh7-rt.googleusercontent.com/docsz/AD_4nXduzJTtpQVG08da_r0-kg1B5yy4phVcuAbdPrz8q68B2_5FnC6bmdmaa6aeogjMpqa63mKeJ-R5LEi5zguVctw4K0nIM2pR-AFEKXNNqD6rxomjM5XaAuurPti0pR_B3txo6dDDOQ?key=luLiz2GY4XjFT_nYY-mTIQJp" alt=""><figcaption></figcaption></figure>

> 提醒：進行回測會消耗回測點數。


# 策略編輯器（回測&交易機器人）

**目錄**

1. 功能總覽
2. 如何建立策略
3. 如何執行回測
4. 如何建立交易機器人
5. 常見問題

### 一、功能總覽：什麼是策略編輯器？

策略編輯器是 CoinKarma 的核心功能，協助用戶利用 CoinKarma 的指標構建交易策略，並且進行回測驗證歷史績效，以及一鍵部署為自動化交易機器人。

主要包含三個核心概念：

* **策略 (Strategy)**：您的交易邏輯核心。定義在什麼條件下進場（開倉）與離場（平倉）的規則。
* **回測 (Backtest)**：策略的驗證機制。利用歷史數據模擬策略表現，提供報酬率、最大回撤 (MDD) 等關鍵數據分析。
* **交易機器人 (Trading Bot)**：策略的實戰應用。將驗證後的策略串接至 OKX 交易所，實現全自動化交易。

### 二、如何建立策略

您有兩種方式可以建立策略：

#### 方式一：自定義策略 (Custom Strategy)

適合有明確交易想法的用戶。

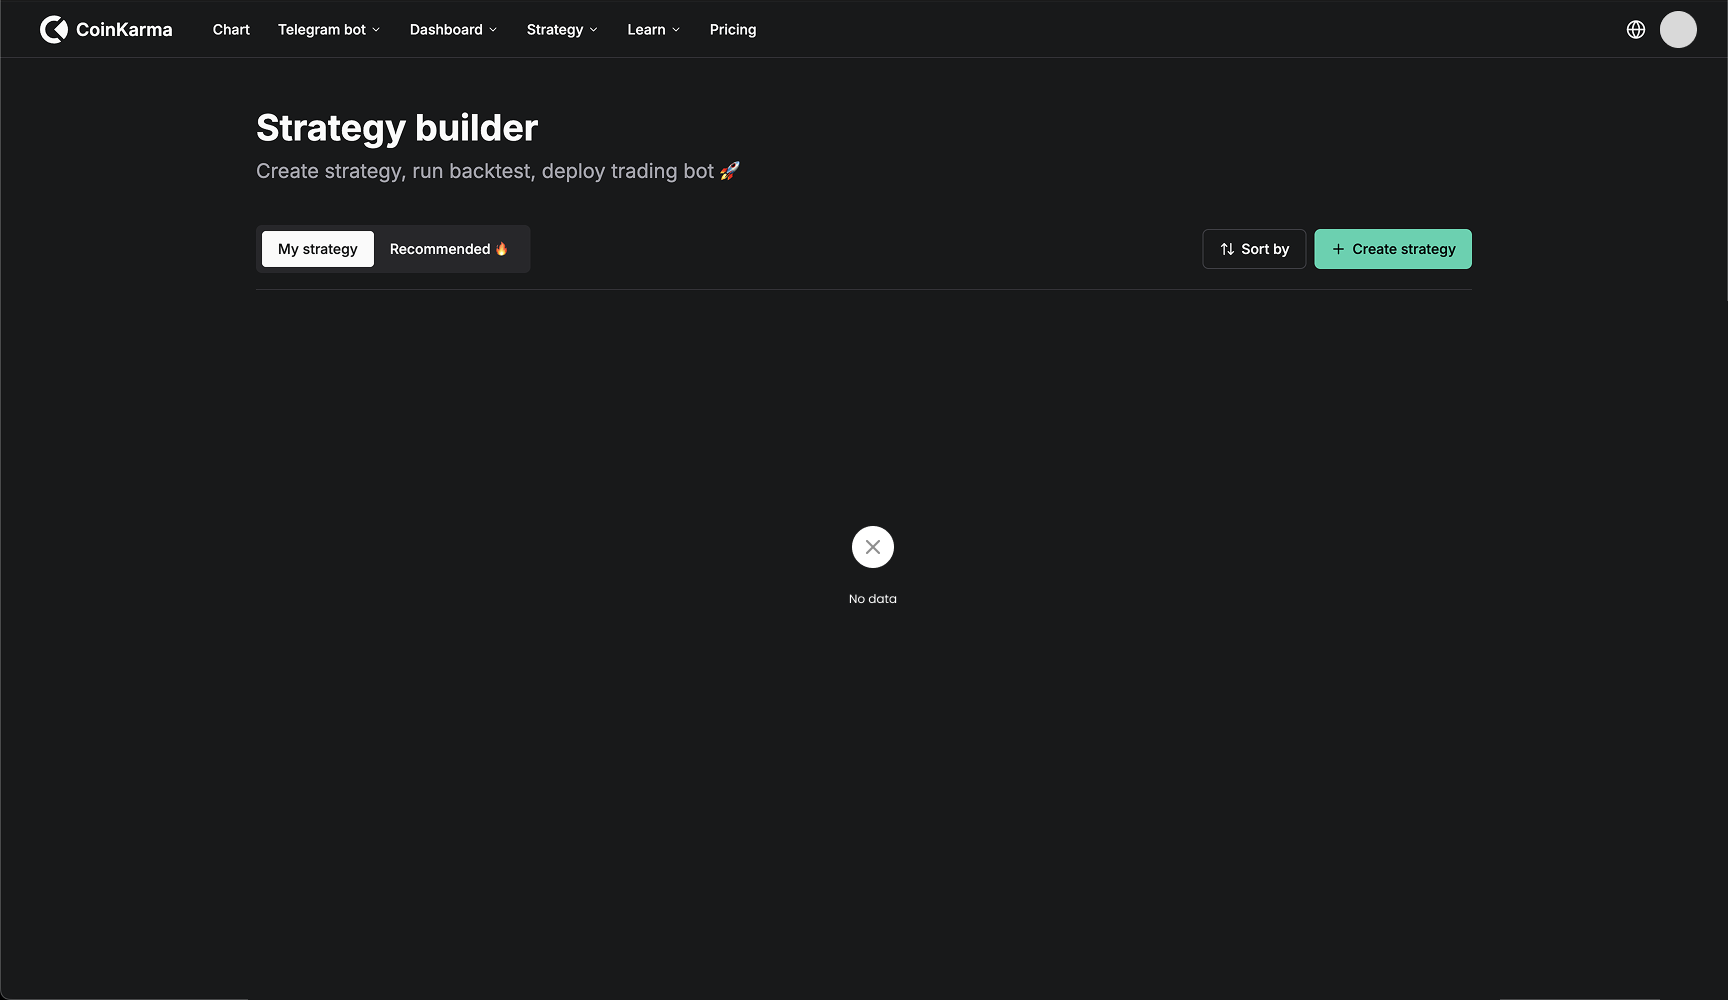
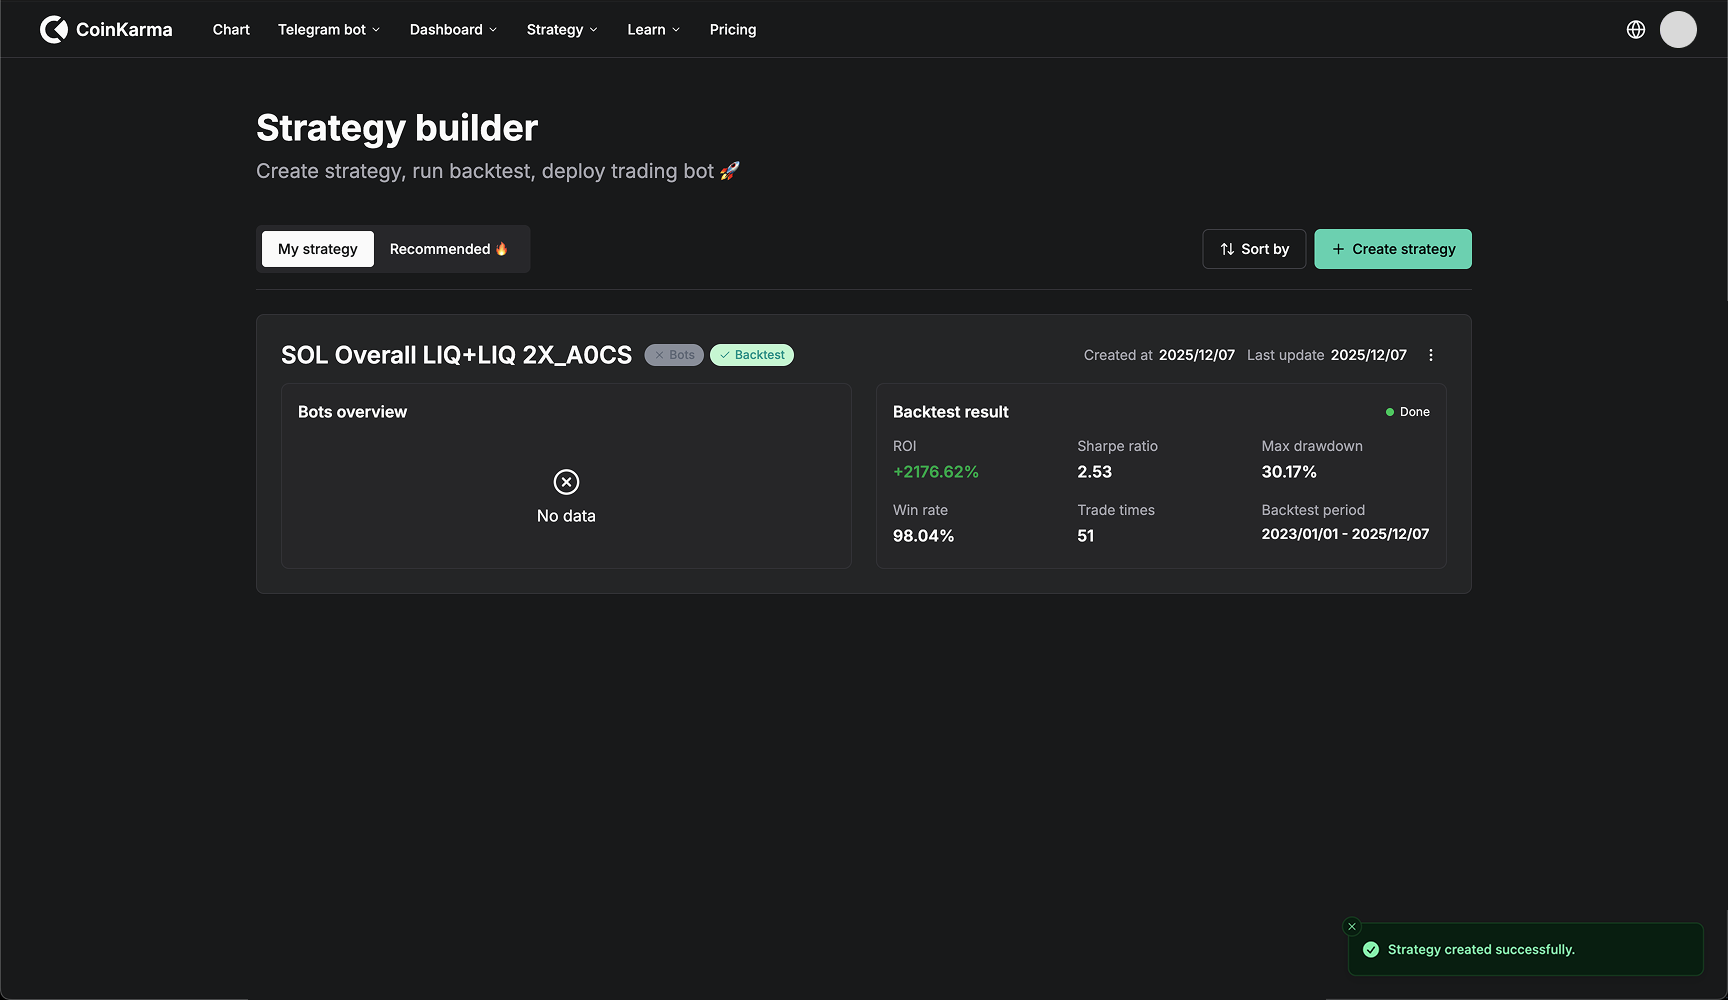
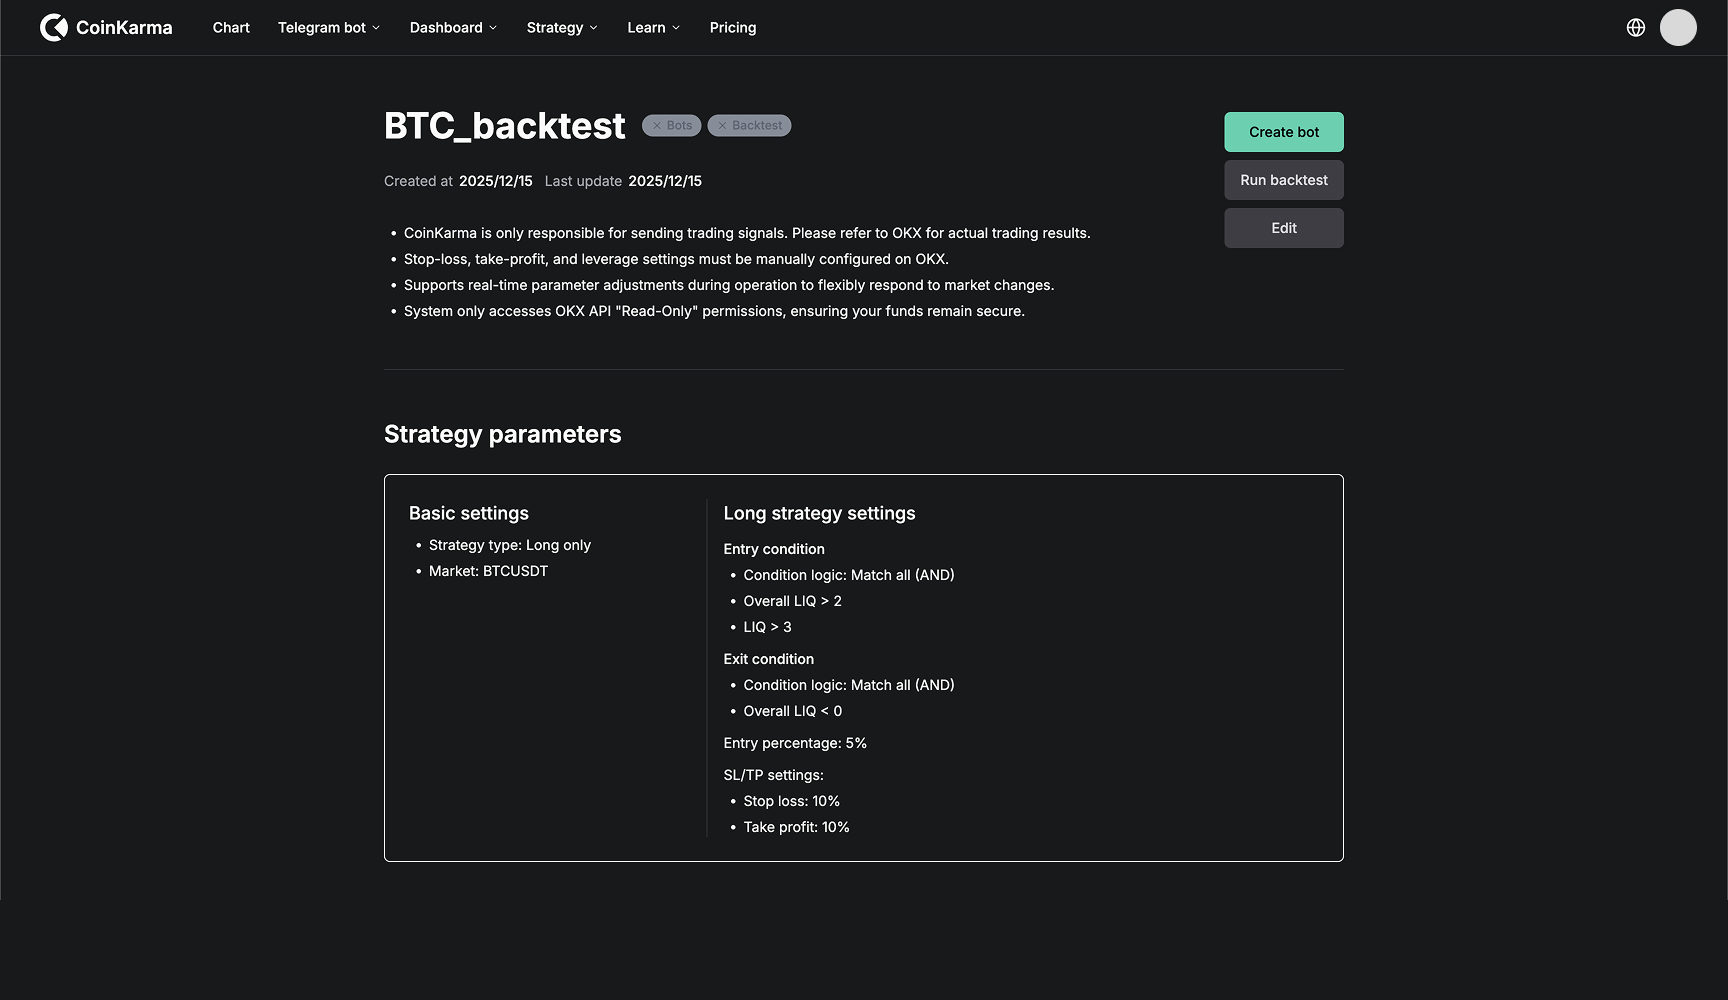
1. 點擊頁面上的 **「+ Create strategy」** 按鈕。
2. 在編輯器中輸入您的進出場邏輯與指標參數。
3. 確認無誤後點擊 **「Submit」**，即可在「My strategy」中查看該策略。

<figure><img src="/files/S7mqdJjcJVqBo3sFVHVp" alt=""><figcaption></figcaption></figure>

<figure><img src="/files/NZNsu7oyTvE5aSq9nYhX" alt=""><figcaption></figcaption></figure>

<figure><img src="/files/jUFrb2ee0Iqz5DnFXzsa" alt=""><figcaption></figcaption></figure>

#### 方式二：使用官方推薦策略 (Recommended Strategy)

適合新手或想參考官方邏輯的用戶。

1. 切換至 **「Recommended」** 分頁。
2. 瀏覽官方精選的策略列表。
3. 選擇感興趣的策略，點擊 **「添加到我的策略」** (Add to my strategy)。
4. 系統將自動複製該策略至您的個人庫中，您可以直接使用或進行修改。

<figure><img src="/files/7KvLovTA6VhmpQaGHIut" alt=""><figcaption></figcaption></figure>

<figure><img src="/files/XA2CfcvRKDTlKqCVtrJv" alt=""><figcaption></figcaption></figure>

### 三、如何執行回測

在投入真實資金前，強烈建議先進行歷史回測。

1. 在策略頁面點擊 **「Run backtest」**。
2. 在彈出的視窗中設定回測參數：
   * **時間起點/終點**：選擇您想驗證的歷史區間。
   * **槓桿 (Leverage)**：設定模擬交易的槓桿倍數。
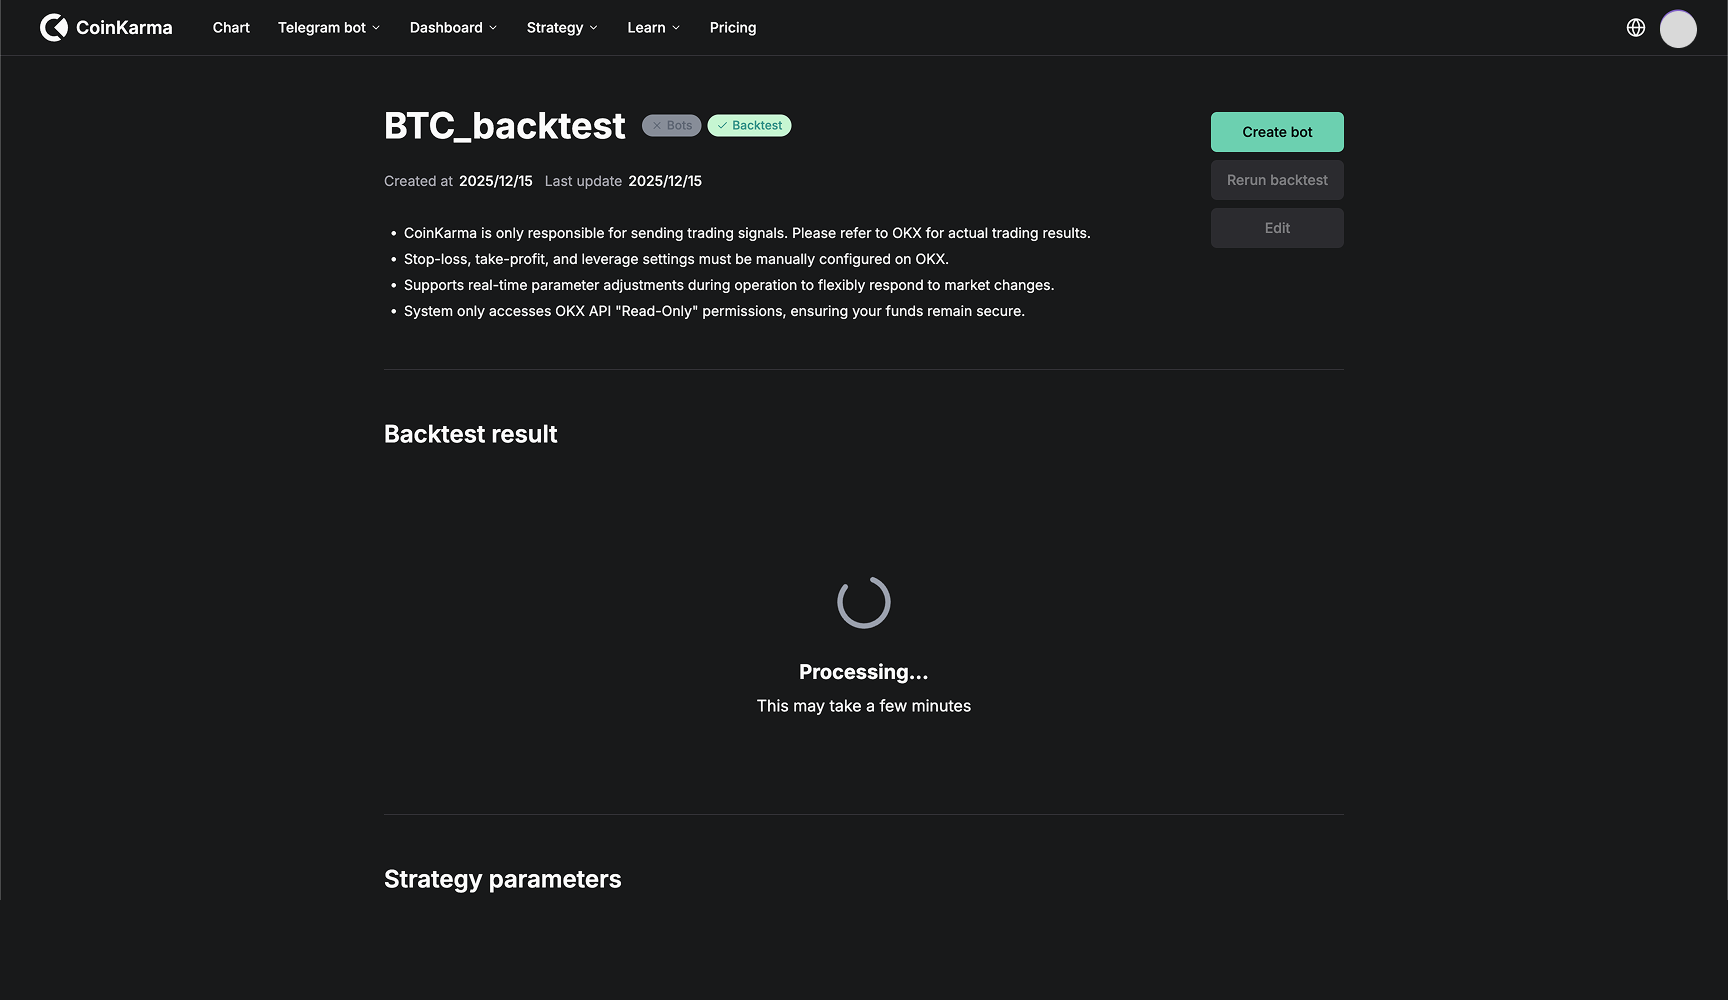
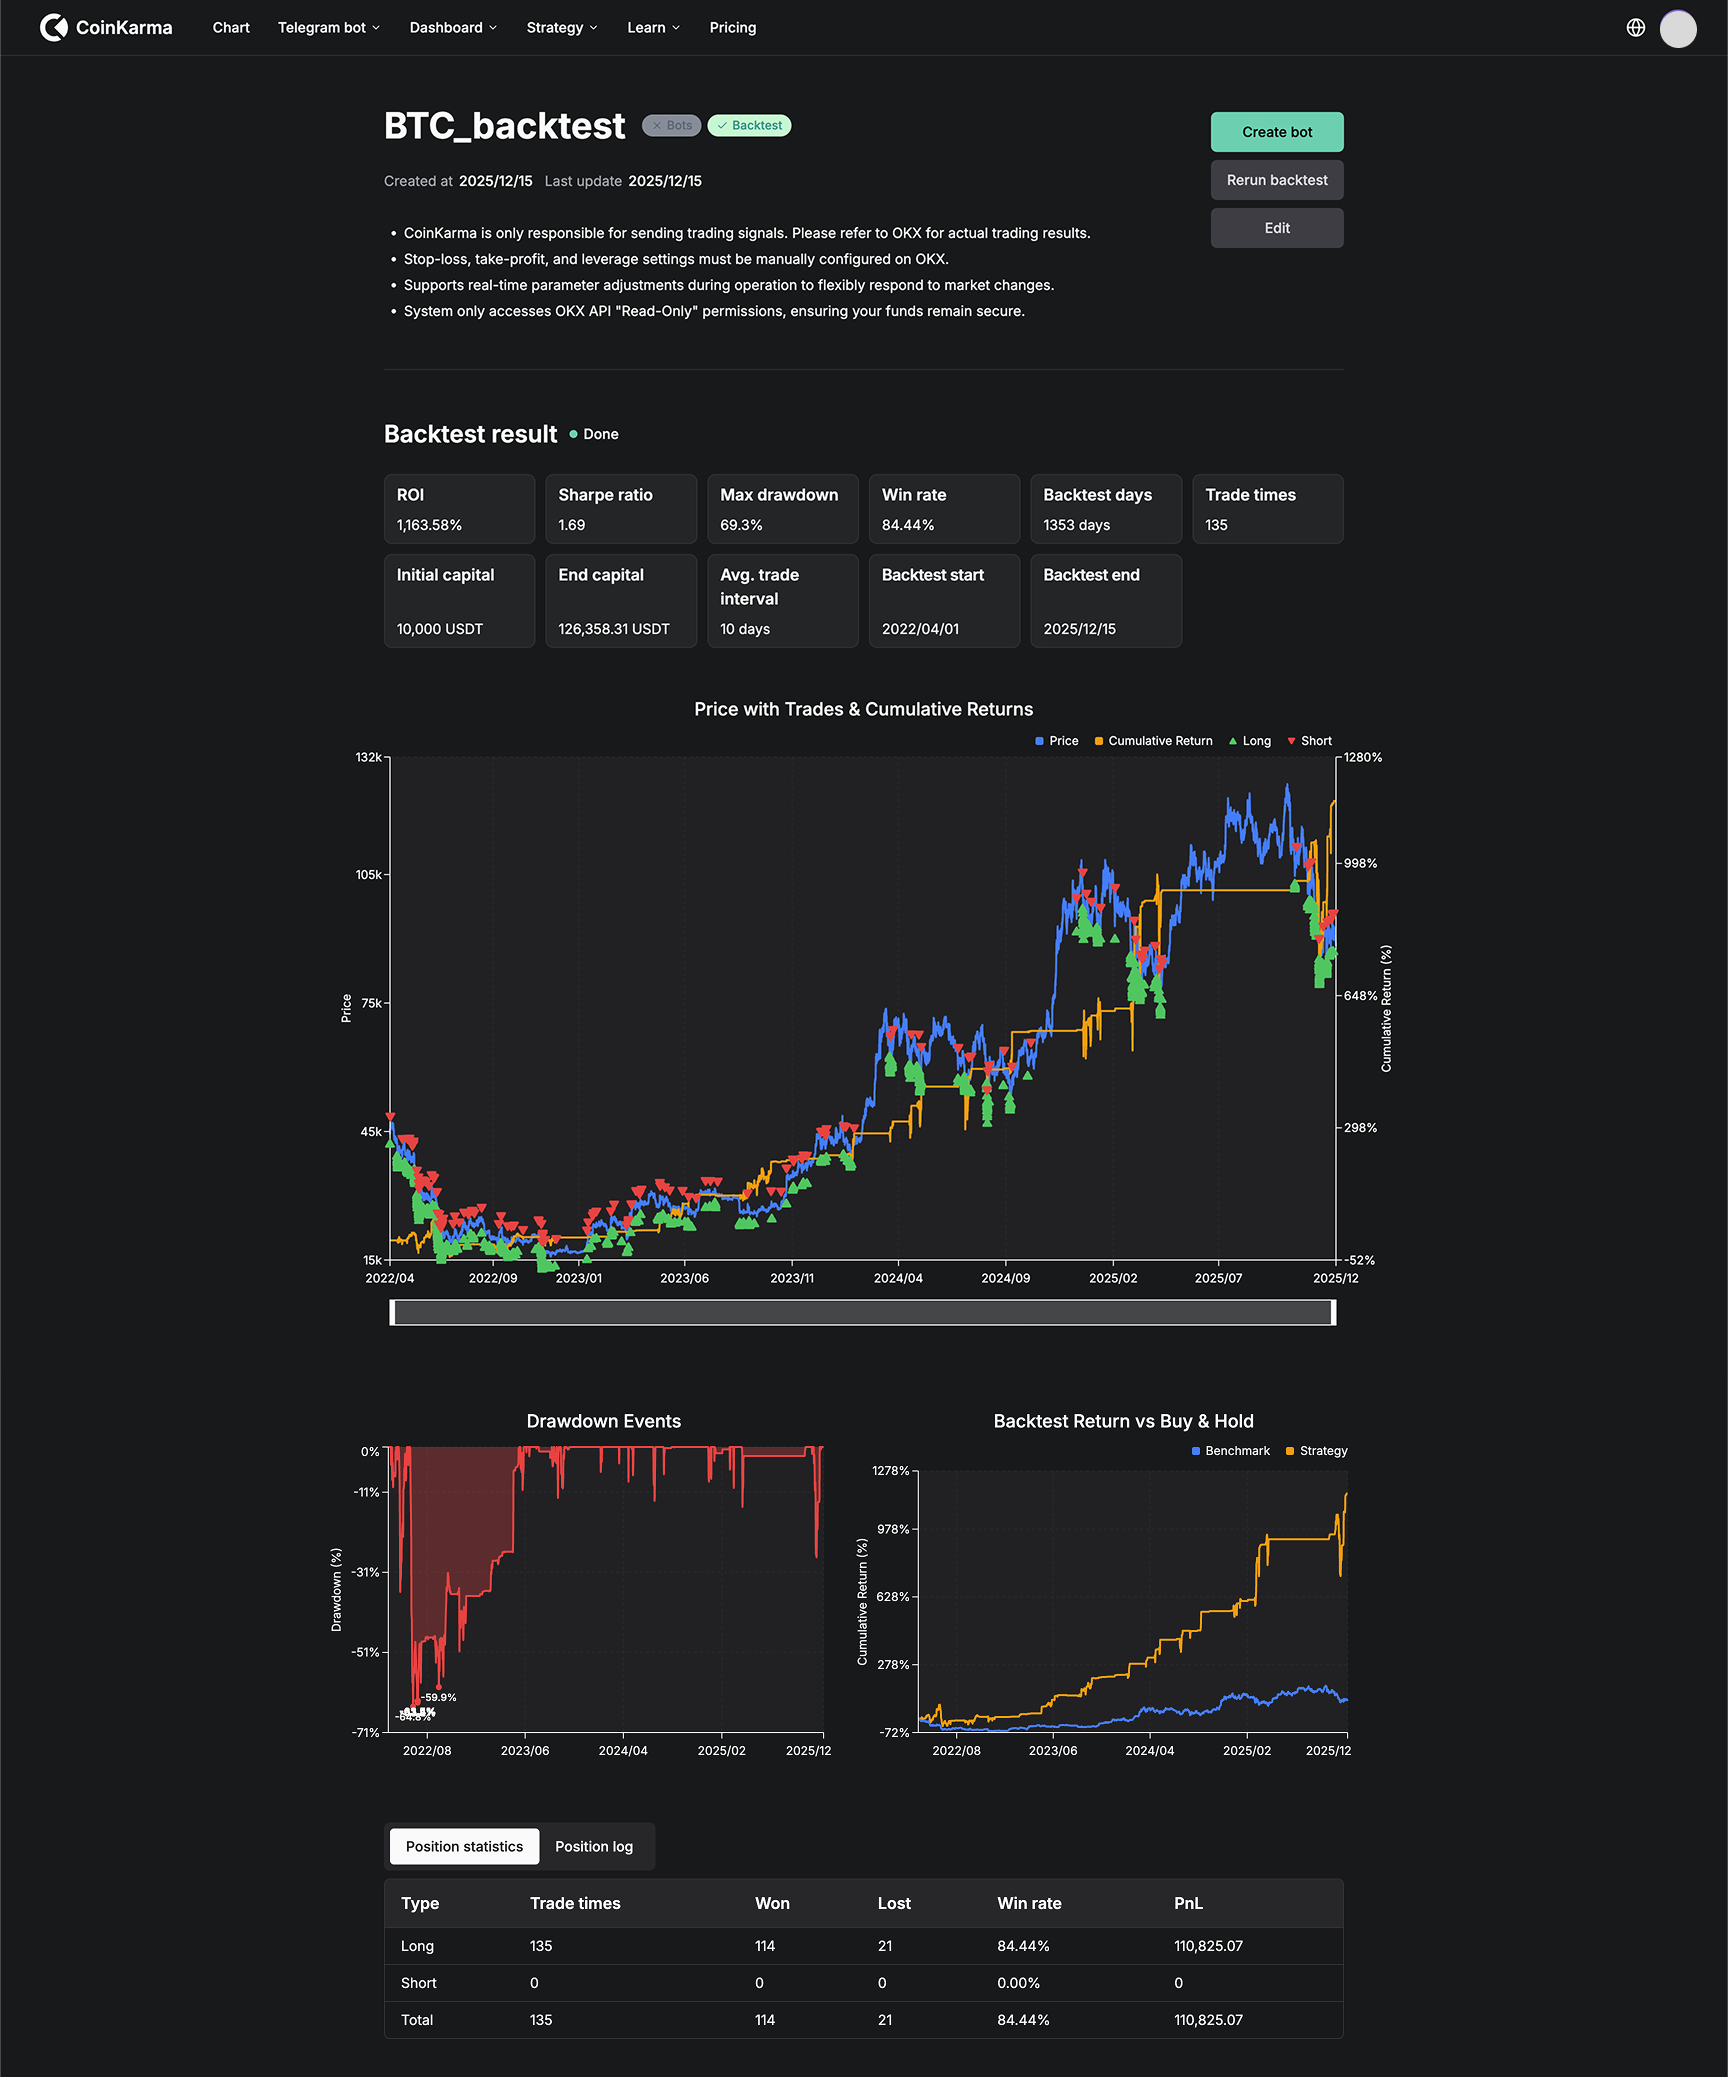
3. 點擊送出。系統將開始運算，依數據量大小，通常約需 **1-5 分鐘**。
4. 運算完成後，您將看到詳細的績效分析報告。

<figure><img src="/files/s4hyQBoNcnI94GXa3Ixb" alt=""><figcaption></figcaption></figure>

<figure><img src="/files/tdjfCiFA8xnCDB7YEI2h" alt=""><figcaption></figcaption></figure>

<figure><img src="/files/uo1D5qMTf6juONqClq4a" alt=""><figcaption></figcaption></figure>

<figure><img src="/files/hGovnV7a92ZTdpHLaPoM" alt=""><figcaption></figcaption></figure>

### 四、如何建立交易機器人

當您對策略的回測表現滿意後，可將其部署至 OKX 進行自動交易。

#### 步驟 1：綁定 OKX 帳戶

1. 點擊 **「Create bot」** 按鈕。
2. 系統將引導您綁定 OKX API（若尚未綁定）。
   * 安全聲明：此 OKX API 權限為「唯讀權限(Read-Only)」，無法進行任何資金操作
   * 注意事項：若您之前曾綁定失敗，請務必前往 OKX API 管理頁面刪除舊的 API Key，再重新進行綁定流程。

<figure><img src="/files/s4hyQBoNcnI94GXa3Ixb" alt=""><figcaption></figcaption></figure>

<figure><img src="/files/wtiWF8BxK92fOpH6oW0p" alt=""><figcaption></figcaption></figure>

<figure><img src="/files/W7ZGheLtMCWYpXzNLWT4" alt=""><figcaption></figcaption></figure>

#### 步驟 2：提交審核與啟用

1. 綁定完成後，在確認視窗勾選同意條款並點擊 **「Submit」**。
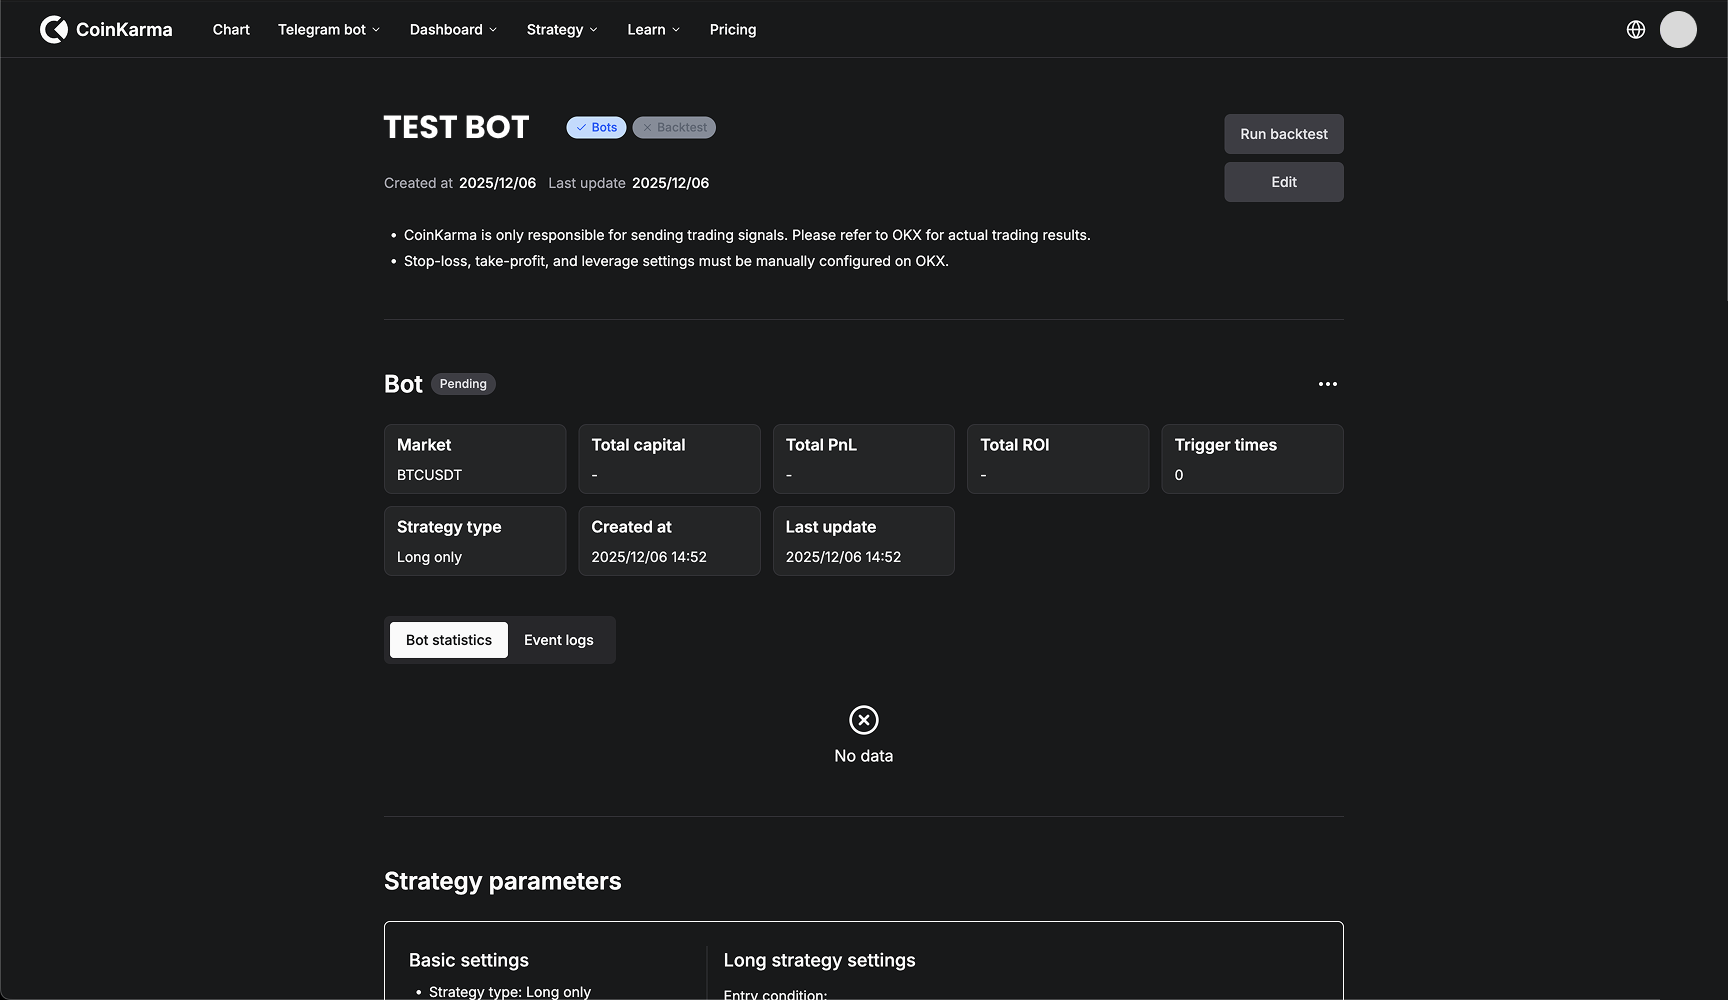
2. 此時機器人狀態將顯示為 **Pending (審核中)**。請等待 OKX 系統審核（通常於 24 小時內完成）。
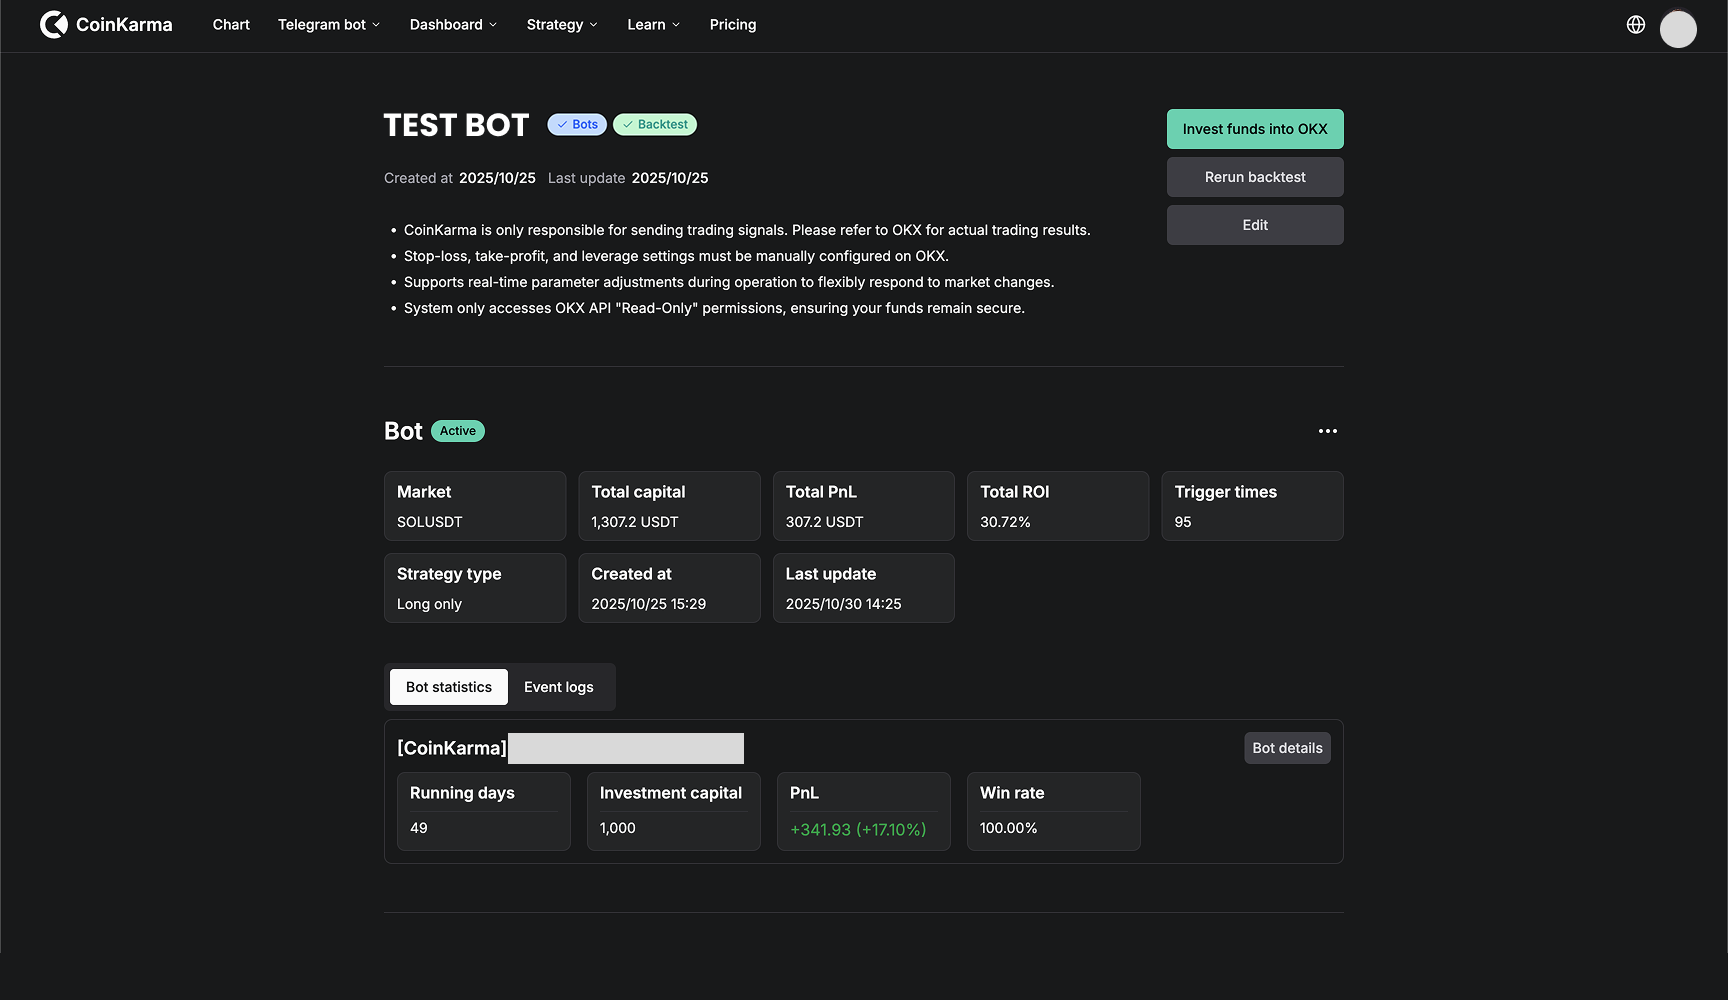
3. 審核通過後，狀態將更新為 **Active (啟用中)**。

<figure><img src="/files/uGrBnRRywp2IDEWx7nlg" alt=""><figcaption></figcaption></figure>

<figure><img src="/files/9YfEIa3pbk9qX2hDd1kK" alt=""><figcaption></figcaption></figure>

<figure><img src="/files/6YGdhmKmRthsVgz6wnZF" alt=""><figcaption></figcaption></figure>

#### 步驟 3：投入資金與開始交易

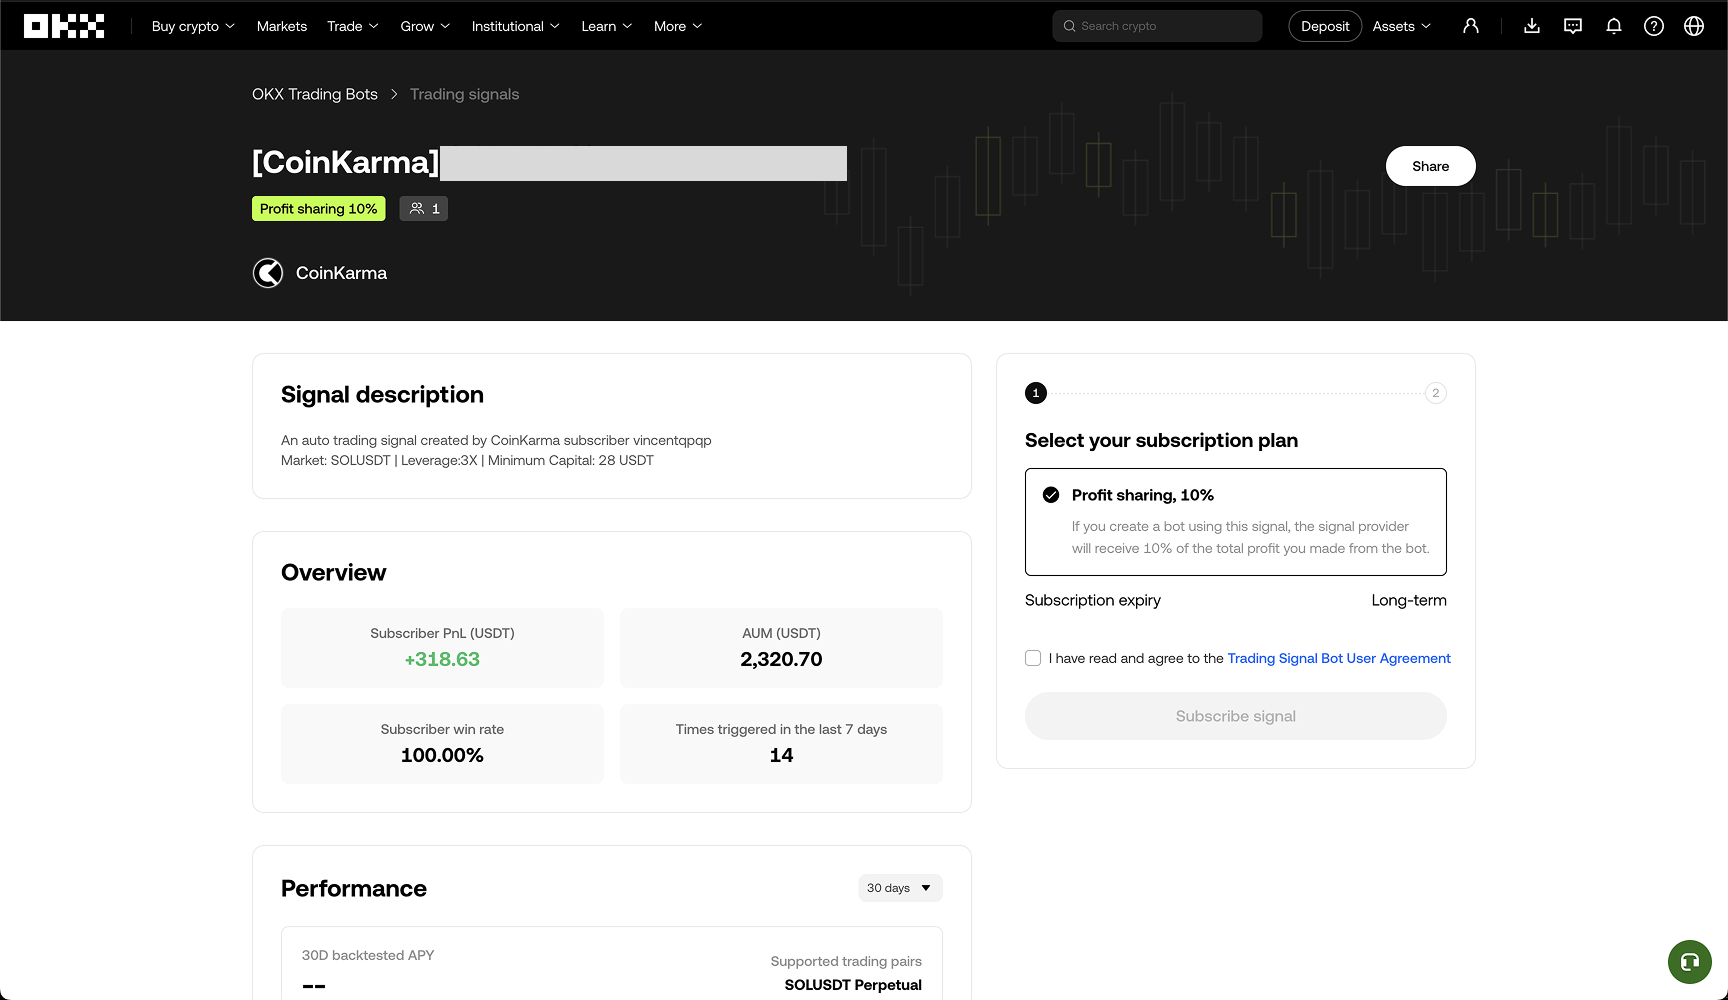
1. 點擊 **「Invest funds into OKX」** 按鈕，系統將跳轉至 OKX 的信號訂閱頁面。
2. 在 OKX 頁面上確認訂閱，並設定您欲投入的**保證金金額**與**槓桿倍數**。
3. 完成設定後，交易機器人即正式啟動。CoinKarma 將根據您的策略邏輯自動發送交易信號，由 OKX 執行下單。

<figure><img src="/files/SCQ8y3j6quJmveHkkT0f" alt=""><figcaption></figcaption></figure>

<figure><img src="/files/r4P2Tww5nkhaSVwoG8OS" alt=""><figcaption></figcaption></figure>

<figure><img src="/files/7TH7iOQwkIEf7GkiLr5S" alt=""><figcaption></figcaption></figure>

<figure><img src="/files/KbPcnk30uN9N3CCtMpMA" alt=""><figcaption></figcaption></figure>

### 五、常見問題

#### Q1：交易機器人的止盈 (Take Profit) 與止損 (Stop Loss) 該如何設置？

止盈與止損需直接於 OKX 交易所介面 進行操作。

**操作路徑：** 進入 OKX 倉位管理頁面 → 選擇信號機器人 → 點擊欲設置止盈止損的機器人點擊詳情 → 找到 **「止盈 (Take profit)」** 或 **「止損 (Stop loss)」** 選項進行數值設定即可。

**注意**：OKX 信號機器人的止盈止損採用「價格百分比」計算，即當價格相對於進場價達到設定的漲跌幅百分比時，系統將自動觸發平倉。

<figure><img src="/files/04qpFHWQb78lj3SH8e6L" alt=""><figcaption></figcaption></figure>

<figure><img src="/files/R9Zj8u5SPMXGSGSz9g0e" alt=""><figcaption></figcaption></figure>

#### **Q2：如何設置交易機器人的交易槓桿 (Leverage)？**

槓桿倍數需在 **機器人的投入保證金階段** 設定。

* **操作說明：** 在您投入保證金 (Margin) 的頁面中，會有一併調整槓桿倍數的選項，請務必在提交機器人前確認槓桿倍數是否符合您的風險承受度。

<figure><img src="/files/7TH7iOQwkIEf7GkiLr5S" alt=""><figcaption></figcaption></figure>

#### **Q3：建立並提交機器人後，審核需要多久時間？**

在您提交機器人策略後，OKX 官方通常會於 **24 小時內** 完成審核流程。審核通過後，機器人即可開始接收信號並運作。

#### **Q4：交易機器人的進場倉位比例是按照「初始本金」還是「當前餘額」計算？**

機器人的進場信號採用 **動態餘額百分比 (Percentage of Balance)** 模式

* **計算方式：** 系統會根據您當前的「可用餘額」來計算下單金額。
* **複利效應：** 這意味著進場金額並非固定鎖定在「初始本金」，而是包含了「初始本金 + 已實現盈虧」。若策略獲利，隨後的下單金額會相應增加（複利）；反之則會相應減少。

#### **Q5：交易機器人會使用我的 API Key 進行交易嗎？**

**不會，請您放心。**

* **交易執行：** 我們的機器人是 CoinKarma 透過 **Webhook** 技術傳送交易信號給 OKX，並非直接透過 API 控制您的帳戶進行下單。
* **權限說明：** 若平台需要您提供 API Key，該 Key 僅具備 **「唯讀 (Read-Only)」** 權限，用途僅限於同步數據與展示績效，無法挪用資金或執行交易。

<figure><img src="/files/wtiWF8BxK92fOpH6oW0p" alt=""><figcaption></figcaption></figure>

#### **Q6：有哪些國家或地區無法使用交易機器人服務？**

本服務依循 **OKX 交易所的合規政策**，部分地區因當地法律規範限制，可能無法使用相關服務（特別是衍生品交易）。

根據 OKX 最新的風險披露聲明，受限制的司法管轄區包括但不限於：

* **北美地區：** 美國（含所有海外領土）、加拿大。
* **亞太地區：** 香港、日本、馬來西亞、新加坡（僅限現貨，不支援衍生品）、韓國（限制衍生品服務）、孟加拉、印度、尼泊爾、北韓。
* **其他地區：** 英國（限制衍生品）、伊朗、俄羅斯、古巴、敘利亞、烏克蘭特定地區（克里米亞等）、阿爾及利亞、玻利維亞等。

> 注意： 合規地區名單可能隨 OKX 政策更新而變動，詳細與最新資訊請以 OKX 官方服務條款 公告為準。

#### Q7：交易機器人的分潤比例為何？

平台採行 **10% 的績效分潤機制 (Performance Fee)**。

僅當交易機器人為您產生實際獲利時，CoinKarma 才會收取該筆獲利的 10% 作為費用；若無獲利，則不收取費用。

#### **Q8：為何「最大回撤 (MDD)」與「實際平倉虧損」的金額不同？**

這是因為計算的基準不同。「平倉虧損」僅記錄**已實現**的結果（出場點）；而「最大回撤」則會計算持倉期間曾經歷過的**最大浮動虧損**（過程中的最低點）。

**舉例來說：** 假設您在BTC $100,000 時開多單。

1. 盤中價格一度跌至 **$80,000**（此時浮動虧損為 -20%，這會被計入最大回撤）。
2. 隨後價格反彈，您最終在 **$95,000** 時止損平倉（實際已實現虧損為 -5%）。

在這個案例中，您的實際虧損只有 **5%**，但策略的最大回撤會顯示 **20%**。這能更真實地反映該策略在極端行情下可能面臨的風險。

#### Q9：已經跑過回測的策略，可以修改參數重跑回測嗎？

可以，點擊「Edit strategy」編輯策略參數，然後再「Rerun backtest」即可修改參數重跑回測

#### Q10：**正在 OKX 上運行的交易機器人，可以修改策略參數並即時生效嗎？**

**可以。** 修改方式與回測相同，請點擊 「Edit strategy」 修改參數並儲存。 更新成功後，**新策略將立即生效**，CoinKarma 會即刻改用新的邏輯來發送交易信號，您無需停止機器人或重新部署。


# CoinKarma Insight

## 什麼是 CoinKarma Insight

CoinKarma Insight 是全天候不間斷掃描 40+ 個獨家指標的所有組合，找出歷史上真正有統計優勢的交易 Pattern 的系統。

Insight 有效解決了傳統人工覆盤中指標組合空間過大（40+個獨家指標）、主觀偏見及策略過擬合的交易痛點，並透過「AI 系統性掃描」、「強制樣本外驗證」與「Telegram 即時推播」三階段流程，嚴格篩選出具統計顯著性的「多維度共振」或「特定環境極端值」交易 Pattern。<br>

<figure><img src="/files/OrW4dv8lRbu8Sn6CK2sk" alt=""><figcaption></figcaption></figure>

## 如何運用 CoinKarma Insight

經過驗證的交易 Pattern 會進入實戰監控池，一旦市場條件觸發，Telegram 會立即推播該交易 Pattern 訊號，無須時刻盯盤。

<img src="/files/Ww33a19Cu4Wdmsm0cro3" alt="" height="567" width="530">

## CoinKarma Insight 的 Pattern 型態

Insight 的每個 Pattern 都會結合市場趨勢判斷（上漲 / 下跌 / 盤整）作為前提環境，在這個基礎上有兩種型態：

<table data-header-hidden><thead><tr><th width="189.58587646484375"></th><th width="309.3819580078125"></th><th></th></tr></thead><tbody><tr><td>Pattern 型態</td><td>核心概念</td><td>實際案例</td></tr><tr><td>多維度共振型</td><td><p>抓取「多維度確認」，多個來自不同維度的指標同時出現共振，並指向同一個市場方向。</p><p><br></p></td><td>Notional BTC Z14 × Pulse Z21 × LSUR。以上三個來自不同維度的指標同時出現共振之組合。</td></tr><tr><td>特定環境下的極端值型</td><td><p>抓取「單一維度的極端訊號」，在特定的趨勢環境下所展現的統計優勢。</p><p><br></p></td><td>Acc. Overall Liq，在特定趨勢環境下的極端訊號所展現的統計優勢。</td></tr></tbody></table>


# DCA Martingale Signal

## 什麼是 DCA Martingale Signal

DCA Martingale Signal 是根據幣種的掛單流動性（LIQ）、RSI 強弱、百分位等指標，自動發出做多/做空的跟單訊號頻道。

<figure><img src="/files/fC3YWsr2UU9MObxiLltb" alt=""><figcaption></figcaption></figure>

## 策略概覽

* &#x20;**20 個主流幣種，35 組策略**
  * &#x20;涵蓋盤整/上漲/下跌三種行情
  * 全部經 15 分鐘線回測驗證
  * 勝率 ≥ 65%，期望值 ≥ 5%
* **訊號提前預告**
  * 當幣種接近觸發條件時，會提前發出預告通知。
* **關單通知含累計績效**
  * 每次關單時自動統計歷史勝率與累計報酬。

## 跟單方式

當頻道發出新信號時，點擊信號下方的 OKX 專屬連結，依 APP 或網頁版入口前往跟單配置即可。

1. 收到信號推播：Telegram 頻道推來一則含觸發條件與策略表現的完整信號。
2. 點 OKX 專屬連結：點擊信號下方的 OKX 專屬連結，選擇 APP 或網頁版入口。
3. 完成跟單配置：前往跟單配置頁面，設定好即可自動跟上這筆倉位。


# Ultron Signal

## 什麼是 Ultron Signal

Ultron Signal 為 Gold 會員專屬的「信號跟單」策略。

<figure><img src="/files/P7y6nnsUBCiuTjvMmOre" alt=""><figcaption></figcaption></figure>

## 如何跟單

Ultron signal 目前提供兩種跟單平台：

１. OKX 跟單信號版本

２. Hyperliquid Vault 版本

<figure><img src="/files/QAAOlVmXXQWHTxcN7R3M" alt=""><figcaption></figcaption></figure>

<table data-header-hidden data-full-width="true"><thead><tr><th></th><th></th><th></th></tr></thead><tbody><tr><td></td><td>OKX 跟單信號版本</td><td>Hyperliquid Vault 版本</td></tr><tr><td>步驟</td><td><p>1. 透過 <a href="https://www.coinkarma.co/zh-tw/ultron-signal">Ultron signal 連結</a> → 立即訂閱 → OKX</p><p>2. OKX - [Coinkarma] Ultron signal → 使用</p><p>3. 輸入投入保證金 → 創建策略</p></td><td><p>1. 透過 <a href="https://www.coinkarma.co/zh-tw/ultron-signal">Ultron signal 連結</a> → 立即訂閱 → Hyperliquid</p><p>2. 點擊「Deposit / Follow」並輸入要投入的 USDC</p><p><br></p><p>* 提前準備：<br>1. 若還沒有 Hyperliquid 帳號，可先透過推薦連結註冊享手續費4%折扣：<a href="https://app.hyperliquid.xyz/join/COINKARMA">Hyperliquid註冊連結</a></p><p>2. 在 Arbitrum 錢包準備 USDC 與少量 ETH 作為 Gas</p><p>3. 登入後在 Portfolio 頁面選擇 Deposit，將 USDC 存入 Hyperliquid L2</p></td></tr></tbody></table>

## 跟單資訊

<table data-header-hidden><thead><tr><th width="154.412353515625"></th><th></th><th></th></tr></thead><tbody><tr><td></td><td>OKX 跟單信號版本</td><td>Hyperliquid Vault 版本</td></tr><tr><td>操作幣種</td><td>$BTC</td><td>$BTC</td></tr><tr><td>操作方向</td><td>多空都做</td><td>多空都做</td></tr><tr><td>槓桿倍數</td><td>預設 3 倍槓桿。<br>( 可評估自身風險偏好，自行調整槓桿倍數； 若有自行調整槓桿倍數且高於 3 倍，建議跟單前 ➜ 手動加入「高級設置-離場設定-止盈止損」的條件 )</td><td>預設 3 倍槓桿。<br>( 無法自行調整槓桿倍數及止盈止損條件 )</td></tr><tr><td>最低跟單金額</td><td>槓後 $1,000 U</td><td>槓後 $100 U</td></tr><tr><td>盈利分潤</td><td>10%</td><td>10%</td></tr></tbody></table>

### 策略原理介紹

Ultron Signal 以自研指標 **Market Pulse Index（MPI）** 為核心，用於判斷市場強弱、決定進出場時機與動態調倉比例。

**多層動態調整（Multi-Layer Dynamic）：**\
策略同時考量多層市場特徵，包括：

* 長天期均線（趨勢方向）
* RSI（市場動能）
* 近期已實現波動度（市場活躍度）

這些因子會共同影響閾值設定，讓策略能隨市場結構變化自動調整。

**No-Short Filter（勿空保護）：**\
當買盤力量顯著強於賣盤時，系統會自動啟動「勿空」機制，暫停建立空單，\
以降低逆勢風險、提升多空判斷靈活性。

## 止損機制說明

Ultron Signal 並未設定固定的止損線，主要原因是每位用戶使用的槓桿倍數不同，若採用統一止損線，容易導致高槓桿過晚止損、低槓桿又過早離場，而策略本身已具備動態風控邏輯。

舉例：若策略目前持有多頭倉位，當市場出現價格過度下跌（Overextend）、MPI 鈍化時，Ultron 會在反彈階段自動減倉或出場，形成 「自然止損」 效果。

以 3 倍槓桿為例：即便遇到如 2025 年 4 月的劇烈回撤，最大回撤（MDD）約僅 20% 左右，風險仍在可控範圍內。因此建議以 3 倍槓桿以內運行策略，若使用更高槓桿，可在 OKX 訂閱信號時，在 「高級設置」 中自行添加止盈止損條件。<br>


# OKX 推薦碼換綁指南

想要享受訂閱折扣與交易獎勵嗎？只需簡單幾個步驟，即可確認是否符合換綁資格並完成綁定！

## 換綁步驟說明 <a href="#f3aab62b-c6c2-4600-840c-e5787c2ca6bb" id="f3aab62b-c6c2-4600-840c-e5787c2ca6bb"></a>

1. **點擊官方換綁連結：** <https://www.okx.com/ul/J6l2R5>

2. **手動輸入推薦碼：**&#x20;

   * 其他國家 KYC 用戶輸入：`COINKARMA`
   * 中國大陸 KYC 用戶輸入：`COINKARMACN`
   * 若系統顯示錯誤畫面，代表該帳號目前不符合換綁條件（詳見下方說明）。

   <figure><img src="/files/SHB6fvC7BPFBWyF5VnNS" alt=""><figcaption></figcaption></figure>

3. **等待審核通知：** 提交成功後，約需 **1 個工作天**。收到 OKX 官方通知後，即代表正式完成綁定。

<figure><img src="/files/BG5OJnYSumpiujbV77WN" alt=""><figcaption></figcaption></figure>

***

## 換綁資格限制 <a href="#id-477f4242-4097-475a-8af3-f8fe1af1dfb7" id="id-477f4242-4097-475a-8af3-f8fe1af1dfb7"></a>

若您的帳號出現無法綁定的情況，通常是因為以下原因：

* **活躍交易帳戶：** 該帳戶平時已有高頻率的交易紀錄。
* **已有推薦紀錄：** 帳戶先前曾邀請過他人使用推薦碼。

***

## 綁定 CoinKarma 的專屬好處 <a href="#id-45591bff-a41d-4586-a80d-3a6f61faaf1c" id="id-45591bff-a41d-4586-a80d-3a6f61faaf1c"></a>

成功綁定後，您將獲得以下三大核心優勢：

* **【訂閱優惠】**：CoinKarma 訂閱費全面 **9 折**。

  <figure><img src="/files/XHRSVxFKxKzrfdVSQwnW" alt=""><figcaption></figcaption></figure>
* **【交易量換點數】**：交易量可自動兌換為點數，並用於訂閱期延長（[參考：交易量換點數詳細說明](https://docs.coinkarma.co/features-guide/okx-coinkarma-jiao-yi-liang-huan-dian-shu)）
* 【**手續費減免】：**&#x4EAB;有 OKX 交易手續費 **10%** 減免。

***

若換綁流程有任何疑問，歡迎私訊客服  👉 <https://t.me/CoinKarma_Roman>


# OKX Coinkarma 交易量換點數

使用 CoinKarma 推薦碼註冊 OKX 帳號，該 OKX 帳號的永續合約與現貨交易量將可轉換成 CoinKarma 點數，點數可用來兌換與延長 CoinKarma 的訂閱方案 (每 25,000 USD 交易量可換 1 點，1 點相當於 0.5 USD)。

<figure><img src="/files/Uq6COb5OeT7DibZkm9aF" alt=""><figcaption></figcaption></figure>

## 綁定與兌換

1. 用 CoinKarma 專屬推薦連結[註冊 OKX](https://www.okx.com/join/coinkarma)
2. 在[帳戶頁](https://www.coinkarma.co/zh-tw/account)綁定 OKX 帳號
3. 綁定後於[此頁](https://www.coinkarma.co/zh-tw/account/referral/rules)查看累積交易量（交易量將於每月初自動兌換成點數）
4. 點數可於[此頁](https://www.coinkarma.co/zh-tw/account/referral/redeem)兌換延長 CoinKarma 訂閱

## 注意事項

* 若為免費用戶可透過點數進行方案兌換；若為付費會員，點數延長將以您現行的訂閱方案為主，如：您現在為 Gold 年費訂閱，只能兌換 Gold (1 year）方案。
* 若之前已使用過 Benson 個人邀請碼註冊 OKX 交易，可直接跳過步驟 1，直接到步驟 2 綁定 OKX 帳戶，一樣享有 OKX 合作方案。
* 如果已經有綁定帳號，且想要嘗試換綁，詳細資訊與步驟請參考[換綁說明頁面](https://docs.coinkarma.co/features-guide/okx-tui-jian-ma-huan-bang-zhi-nan)。


# 5 Minute QuickStart

Welcome to CoinKarma! CoinKarma is a trusted platform for professional crypto traders and institutions, offering a wide range of insightful trading indicators.

## 🔈 Limited Channel｜Join Exclusive Channels for Real-Time Updates

{% hint style="info" %}
The following channels are exclusively available to paid members. Link your account [here](https://www.coinkarma.co/account), then click the 「 Telegram Bot 」on navigation bar to join.
{% endhint %}

* 📢 **Token Screener**: A members-only channel that provides hourly updates, swiftly identifying the strongest and weakest performing tokens. (For more details, visit the [Token Screener page](https://docs.coinkarma.co/english/features-guide/token-screener).)

  <figure><img src="/files/QcJhxl2IOiSJNBMSLaXS" alt=""><figcaption></figcaption></figure>

* 📢  **Market Pulse**: A comprehensive market index offering real-time insights into overall market conditions—helping you catch trend reversals as they happen. (For more details, visit the [Market Pulse page](https://docs.coinkarma.co/english/features-guide/market-pulse).)

  <figure><img src="/files/KxcGOvRvXXRxN9tMMdLA" alt=""><figcaption></figcaption></figure>

* 📢 **Overall Liquidity Alert**: Broadcasts hourly updates on the market cap of BTC + ETH, the liquidity status of various coins, and real-time data of the market-cap-weighted Overall LIQ indicator.&#x20;

  <figure><img src="/files/3rOObEc8RPVqP7HMXtv1" alt=""><figcaption></figcaption></figure>

* 📢 **Grid Trading Signal**: A member-exclusive OKX grid trading strategy signal. It provides a one-click entry based on the Overall LIQ and the Relative Strength Indicator (RSI) of different coins. Exit positions need to be managed manually.

* 📢 **Set Custom Alert**: Set up custom indicator alerts. Receive real-time notifications when the set values are triggered.

## 📋 Dashboard Overview｜Guide to Using the Indicator Dashboard

{% hint style="info" %}
After registering and logging in, enter CoinKarma's[ Chart Dashboard](https://www.coinkarma.co/chart) to observe real-time indicator statuses and review historical data. Here’s a quick guide to common operations
{% endhint %}

* **Add CoinKarma Indicators**：Click on "CoinKarma Indicator" and select the desired indicators (you can choose multiple).

<figure><img src="/files/yVOJIBZcGl9kMpmmg5CR" alt=""><figcaption></figcaption></figure>

* **Adjust Parameters (Benchmark)**：Hover over the indicator name in the bottom left, click the gear icon, and adjust the parameter values. Click "Defaults" to reset to the default values.

<figure><img src="/files/WA92MGNY2ZNKycu2JdqN" alt=""><figcaption></figcaption></figure>

## 🎯 Indicators Tips｜Key Points for Getting Started

* **Featured highlight indicators**

  <figure><img src="/files/kn8EnpRSZrxtQY4MDq6z" alt=""><figcaption></figcaption></figure>
* **Overall LIQ**

  * A market-cap-weighted liquidity indicator used to gauge the overall market liquidity status. The default benchmark values are (2, -2), with red bars appearing when it falls below -2 and green bars above 2. It’s recommended to use this indicator along with CVD, Funding Rate, and ARI for a comprehensive analysis.

  <figure><img src="/files/DXZvCnXjiu7EkpSbIFmw" alt=""><figcaption></figcaption></figure>
* **LIQ**

  * An individual coin liquidity indicator that helps assess the liquidity status of specific coins. The default benchmark values are (3, -3), with red bars below -3 and green bars above 3. You can adjust the benchmarks for different coins and combine them with Overall LIQ and other indicators.

  <figure><img src="/files/xEHFCwrFJCku3aiWEWnX" alt=""><figcaption></figcaption></figure>
* **ALT Resilient Index**

  * This is an altcoin resilience indicator, used to assess how altcoins hold up against BTC during market downturns. The higher the value, the stronger the altcoins perform during a decline. It’s useful for identifying potential market bottoms.

  <figure><img src="/files/a7QpNXYzcuVF4ejOyqjp" alt=""><figcaption></figcaption></figure>
* **Accumulated Overall LIQ**

  * A cumulative sum of the Overall LIQ indicator. You can adjust the parameters for backtesting, with default values set to (24, 70, -70). It tracks the sum of Overall LIQ over the past 24 hours, with green bars above 70 and red bars below -70, helping to spot potential trading opportunities at market highs and lows when combined with Overall LIQ, ARI, and other indicators.

  <figure><img src="/files/qhJKOcF12TkeCRsbngcm" alt=""><figcaption></figcaption></figure>

### 🤝 Referral & Affiliates｜Invite Friends and Alliance Promotion

{% hint style="info" %}
After logging into CoinKarma, click on your profile icon in the top right corner and go to the "[Referral](https://www.coinkarma.co/account/referral)" page to get your exclusive invite link. When you invite friends to join CoinKarma, both you and your friends will earn CoinKarma Points, which can be redeemed for subscription extensions.
{% endhint %}

If you're a KOL or have community resources, your referral rewards can be directly converted into USD cash. Feel free to apply to join our Affiliates Program ▶️  [Application Form](https://www.notion.so/Quickstart-Guide-CoinKarma-3ea2abc7e2974645ad52017dffbb3210#)

### ℹ️ Support｜ontact Customer Service & Learn More

* Coinkarma blog： <https://blog.coinkarma.co/>
* Other inquiries： <https://t.me/CoinKarma_Roman>


# FAQs

CoinKarma Frequently Asked Questions

Welcome to CoinKarma! We invite you to use the information below to quickly familiarize yourself with our indicators and tools. If you have additional questions, please first check the "Frequently Asked Questions (FAQs)" section below. If your question remains unanswered, feel free to post in the "Newbie" channel on Telegram.

***

### How do I join the Telegram group?

First, complete your Telegram account binding on the Account page of our website.

> **Important:** If you click the group invite link before completing the binding on our website, your account will be automatically locked. If this happens, please contact customer support for assistance.

Once binding is complete, return to the homepage and click "Telegram" to join.

For account-related issues, contact our official support directly: 👉 <https://t.me/CoinKarma_Roman>

***

## Product Features

* **What should I do if the CoinKarma website shows errors, indicator data isn't updating, or displays incompletely?**
  * This is usually caused by browser cache or network issues. Please try:
    * Press Ctrl + Shift + R (Mac: Cmd + Shift + R) to force refresh and clear cache
    * Log out and log back in
    * Shut down and restart
    * If you still see a "Failed to load" error, please try again later or contact customer support.
* **How do I get the red and green buy/sell arrows to appear on my chart?**
  * Select "custom-signal" in the indicators to customize the conditions for arrow display. Please refer to the Custom Signal detailed documentation page.
* **Does CoinKarma currently offer API services?**
  * API services are not currently available.
* **Can I only view indicators on the CoinKarma website? Can they be loaded into TradingView**
  * Yes, CoinKarma's proprietary indicators can only be viewed on the official website charts and cannot be loaded into TradingView.
* **I'm a new user (Gold annual member with 14-day trial). Why can't I link OKX or use the strategy bot?**
  * Ultron copy trading and strategy bot features are only available to paid members. These features cannot be used during the trial period. If you wish to use them immediately, you can skip the trial and proceed directly to payment.
* **Why can't I find the USDT internal transfer or payment method switch interface on the "Plans" page?**
  * Currently, renewal payments must use the same method as the original payment (Stripe credit card renewals require Stripe). Self-service switching (e.g., from USDT to credit card) is not supported. For special requests, please contact customer support for manual processing.
* **Are Custom Signal alerts only triggered at the end of each hour?**
  * Yes, the system checks at the hourly candle close. Alerts are only sent if conditions are met at that time.
* **Are the tokens in the Token Screener fixed?**
  * Currently, 40+ mainstream tokens are supported, covering major market hotspots.

***

## Ultron Signal

* **How do I subscribe to Ultron Signal?**
  * First, confirm you are an official Gold plan member (not in trial status). Then go to the Ultron Signal page and click "Subscribe" in the upper right corner.
* **What is the minimum capital requirement for Ultron Signal copy trading?**
  * Post-leverage capital must exceed $1,000 USD.
* **Which platforms does Ultron Signal support? What's different about the Hyperliquid (HL) version?**
  * Currently supported: OKX and Hyperliquid (HL).
    * **OKX:** Centralized exchange, suitable for most users
    * **Hyperliquid:** On-chain derivatives exchange, suitable for users in regions where OKX is restricted
    * **Difference:** Long-term performance is similar between both. The main differences are in trading fees and funding rates.
* **On OKX, can I add funds directly to an active strategy by increasing margin?**
  * Yes. When adjusting margin, make sure to check "Include added margin in invested margin" when increasing funds. This ensures the new capital is included in the strategy's position calculations.
* **Can I run multiple Ultron strategies on one account? For example, one bot at 3x leverage and another at 5x?**
  * Yes, you can.
* **Can I copy the Ultron strategy but use my own high leverage (e.g., 20x)?**
  * You can open a separate bot with high leverage to follow, but the risk is extremely high. High leverage can easily lead to liquidation during strategy drawdowns (e.g., with 20x leverage, a 5% drop from average entry price results in liquidation). This is not recommended for long-term holding.
* **Can I modify the leverage multiplier after creating an Ultron Signal strategy on OKX?**
  * No. Once created, leverage cannot be modified. You need to cancel the copy trade and create a new one.
* **How is the Ultron Signal profit share (10%) calculated?**
  * It uses the High-Water Mark method, settled monthly. The 10% fee only applies to new profit highs. If there's unrealized profit from open positions, no fee is charged.
* **Can I withdraw funds while connected to Ultron Signal?**
  * You can withdraw at any time, but it's not recommended while holding open positions. Withdrawing reduces margin and increases position risk.
* **Does Ultron Signal currently support other cryptocurrencies?**
  * Currently, the official Ultron Signal only trades BTC. For automated trading of other tokens, you can set up your own trading bot.
* **What is Ultron Signal's entry/exit logic?**
  * It primarily uses Multi-Layer Dynamic adjustment rather than fixed thresholds. The core strategy is mainly mean reversion.
* **Does Ultron Signal have price-based stop losses? How does it manage risk?**
  * Ultron Signal does not use fixed stop-loss levels. The main reason is that each user uses different leverage multipliers—a uniform stop-loss would cause high-leverage users to stop out too late and low-leverage users to exit too early. The strategy itself has built-in dynamic risk control. When the market becomes overextended, Ultron automatically reduces positions or exits during rebounds, creating a "natural stop-loss" effect.
* **Should I move from OKX Ultron to the newly launched Hyperliquid version?**
  * Not recommended for frequent switching. Performance is similar on both platforms. HL is primarily provided for members who cannot access OKX.
* **Why can't I deposit to Hyperliquid ("Deposit causes leader share to drop below 5%")?**
  * This is because HL Vault rules require the leader to maintain at least 5% of total vault funds. If copy trading capital grows too large and reduces this ratio, the system will pause deposits. Please wait for official capacity adjustment.
* **If I connect to Ultron Signal now, will it immediately copy the current position ratio?**
  * No. It will wait for the next signal before entering. If positions are currently held, you will remain flat. If subsequent add-on signals occur, you'll start following from 0. Once an exit signal appears and everyone's positions are closed, the next entry will be fully synchronized.
* **Does Ultron Signal compound returns?**
  * Yes. Each entry size is calculated based on account equity. If profits increase, the next entry size will increase accordingly.
* **Can I copy trade if I already have an OKX account?**
  * Yes. Any CoinKarma Gold member can copy trade. You don't need to bind an OKX referral code (though binding one accumulates trading volume for points).
* **As Ultron subscription numbers and capital increase, will my return ratio decrease?**
  * No. From the moment you start copy trading, your performance matches Ultron's performance. It's unrelated to total subscribers or total capital.
* **I tried withdrawing profits from Ultron on HL today, and there was a 1.15% shortfall. Is this part of the 10% profit share?**
  * HL Vault withdrawals are capped at 10%—this is hardcoded, and the protocol doesn't charge additional fees.
  * **Note:** The shortfall is likely due to slippage or gas estimation, not additional charges.
* **If Ultron opens a long position and my account goes full position, will the next add-on signal fail due to insufficient funds?**
  * Running at full position rarely happens. Ultron adjusts positions hourly based on dynamic values (MPI), so it rarely occupies 100% of funds for extended periods.

***

## Indicator Usage

* **What exchanges does LIQ data come from?**
  * USDT pairs primarily come from Binance. USD pairs in Overall LIQ (e.g., BTCUSD, ETHUSD) come from Coinbase.
* **What's the difference between LIQ and Overall LIQ?**
  * **LIQ** is a single-token liquidity indicator. If your chart shows BTCUSDT, it displays BTC's LIQ.
  * **Overall LIQ** is a market-cap-weighted overall liquidity indicator. Regardless of which pair you open, it displays the same data.
  * In short, one looks at individual tokens while the other looks at the overall market. Using both together helps filter more meaningful entry and exit points.
* **How should I use the LIQ indicator with position management for entries and exits?**
  * The LIQ indicator leans toward left-side trading and works better in ranging markets. It may encounter consecutive stop-losses in one-sided counter-trend conditions. Adjust based on your personal risk tolerance—for example, scale in: enter 10% on the first green bar, add another 10% after the 4th bar, or wait until Accumulate LIQ (sum of past 24 candles) reaches a certain peak before entering.
* **LIQ is a range-bound indicator. What should I do in trending markets?**
  * You need your own filter based on your trading style. A simple approach is to use the 200-day MA as a dividing line: above the 200 MA, use LIQ to filter optimal buy points; below the 200 MA, be more conservative with longs.
  * You can also use CVD (Cumulative Volume Delta) to assess trend strength. Only when CVD continues rising is there potential to break through LIQ's red bar selling pressure, and vice versa.
* **Why do I see BTC/USD and ETH/USD in Overall Liquidity Alert, but not on the chart?**
  * USD pair data in alerts comes from Coinbase, while CoinKarma charts primarily use Binance USDT pairs.
* **What timeframe is recommended for the LIQ indicator?**
  * 1 hour (1H) offers the most flexibility and is the recommended timeframe.
* **What's the best way to use LIQ Band?**
  * It's ideal for users who place limit orders, and works even better when combined with dual-currency investment strategies.
* **For the 10% Orderbook DIF parameter, should I enter "2" or the "USD notional value"?**
  * Enter the notional value (difference). For example, if BTC/USDT's Bid/Ask difference is 2,000 coins, enter 2000 (note: the unit is token quantity). This aligns with the Custom Signal default values of 2000/-2000.
* **When does CME Smart Money update?**
  * Taipei time (UTC+8), every Saturday, reflecting the previous Tuesday's positioning (delayed one week during holidays).
* **Is LIQ calculated once per hour? Can it be affected by spoofing orders?**
  * LIQ updates in real-time and settles hourly. Theoretically, it can be affected by spoofing, but manipulating a high-cap asset like BTC requires enormous capital—this is rare. For smaller tokens, LIQ should be interpreted with discretion.
* **Why does my OI-Weighted Funding Rate chart look different from the documentation (both upper and lower sections are green)?**
  * The documentation shows additional benchmark settings (e.g., 0, 0.03). You can also set your own benchmark parameters to adjust display colors according to your observation preferences.

***

## Backtesting & Strategy Bots

* **After submitting a strategy bot, how long does approval typically take?**
  * Signals require OKX approval. Generally, approval occurs by noon (Asia time) each business day, with T+1 being the latest. If status remains pending for over two weeks, consider redeploying or contacting support to report a bug.
* **In the strategy backtesting tool, how is "entry percentage" calculated? E.g., is 5% of total margin or 5% of remaining available margin?**
  * It's calculated based on **initial margin**.
  * Example: Principal 10K, 2x leverage, entry set at 5%. Each entry amount = 10K × 2 × 5%.
  * This means each entry size is fixed (based on principal) until margin is exhausted.
* **If backtesting is set to 5%, does it enter each time conditions are met? Can I set a total capital limit?**
  * Yes, it enters 5% each time conditions are met. No need to set a total capital limit—each Signal Bot uses isolated margin. It's recommended to allocate a specific amount (e.g., 3000U) to that bot.
* **What does the take profit/stop loss percentage mean in the backtesting tool?**
  * It's the TP/SL for each position based on entry price. For example, with 10% position TP/SL and $100 average entry cost, the position exits when price falls below $90 or rises above $110.
* **In the backtesting tool, why does maximum drawdown (MDD) exceed 20% when my stop loss is set at 20%?**
  * Maximum drawdown (MDD) is defined as the difference from peak equity (including unrealized gains) to trough—not the difference between position cost and exit price.
  * **Drawdown is cumulative:** Multiple consecutive losses can cause total drawdown to exceed single stop-loss limits.
  * **Leverage effect:** Drawdown is calculated on the equity curve. With 5x leverage, a 10% price movement causes 50% equity movement.
* **What timeframe does the Strategy Editor use?**
  * The Strategy Editor uses the 1-hour (1H) timeframe.
* **Why don't the backtest drawdown figures match the position records?**
  * **Maximum Drawdown (MDD):** Calculated based on maximum floating loss during holding periods.
  * **Position Records:** Show realized P\&L after closing positions.
  * Often, floating losses during holding are large, but the final exit is profitable—hence the discrepancy.
* **If I set TP/SL in CoinKarma backtesting, will it execute automatically when I launch the bot?**
  * No, it won't execute automatically. TP/SL in backtesting is for reference only. After launching the OKX bot, you need to manually set TP/SL parameters within the OKX system.
* **OKX seems to only allow identical TP/SL parameters for both directions. Can't I set different values for long and short like in CoinKarma backtesting?**
  * Correct, this is an OKX limitation.
  * **Solution:** Create two separate bots—one exclusively for longs, one for shorts—allowing different TP/SL settings for each.
* **Why does my custom trading bot show "unexpected close signal" or errors?**
  * This typically occurs with mixed long/short strategies. For example, the strategy sends a "close short" signal, but you're currently flat—the exchange will report an error. As long as you confirm there's no position, you can ignore this error. It doesn't affect fund security.
* **How can I make a CoinKarma custom bot "stop opening new positions while keeping current positions"?**
  * There's currently no direct pause button. **Workaround:** Modify the bot's entry rule to a condition that can never trigger. This prevents new positions while existing positions still follow exit rules.
* **Why can't I find Karma Index, CVD, and other indicators in the backtest bot?**
  * The bot primarily supports indicators suitable for 1H reversion strategies. General-purpose indicators of other types are not yet included.
* **When adding margin while holding positions, is the next add-on based on "total margin" or "initial margin"?**
  * There's a checkbox when adding margin. Only if checked will calculations use the updated "total margin."

***

## Grid Trading Signal

* **What's the main difference between Ultron Signal and Grid Trading Signal?**
  * **Ultron:** Fully automated copy trading, suitable for passive investing and long-term holding.
  * **Grid Trading Signal:** Semi-automated. Opportunities are posted in the members' group, and you need to click the link to copy parameters yourself. Suitable for users who want to capture range-bound market movements.
* **Which platforms does Grid Trading Signal support for copy trading?**
  * Currently only OKX is supported.
* **What's the logic behind Grid Trading Signal?**
  * Grid Trading Signal provides BTC long/short signals when overall market liquidity triggers certain thresholds.
* **What are the exit conditions for Grid Trading Signal?**
  * **Holding long:** Close when Overall LIQ indicator ≤ -1 or price exceeds the grid upper limit.
  * **Holding short:** Close when Overall LIQ indicator ≥ 1 or price falls below the grid lower limit.
  * Or automatically close with stop-loss when the trade loses 30% of principal.
* **Can the grid channel link directly open the OKX App for ordering?**
  * On some phones, direct clicking may open in an embedded browser. It's recommended to copy the link and open it in Safari or Chrome to ensure the OKX App launches properly.
* **How do I use the grid trading tool? When I click in, it shows "Strategy stopped"?**
  * It's only usable when triggered. If triggered, a notification will appear in the Grid Trading Signal channel, and you can click to copy trade at that time.

***

## Other

* **Are there rewards for inviting friends to use CoinKarma?**

By inviting friends through your personal referral link, both you and your friend will receive 15% subscription extension points, redeemable in the "Points Store." If you're a KOL, you can apply for the Affiliate Program through this link for USDT rewards.

> If you have further questions, feel free to contact our support team via <https://t.me/CoinKarma_Roman>, We'll do our best to assist you.


# LIQ

## What is the LIQ Indicator?

<figure><img src="https://lh7-rt.googleusercontent.com/docsz/AD_4nXfckYrou_5nKpoDakAAa3ZEB4qI9lubNoPqQQX6oSPdHP11ellqrKbVRYoSVcbIU9LV2d0SacKg77-Kt61_LoJmBJa578wcSGXz9tXz4jo52wfj07YJMPh8uS26oBR_uxhv-hKEMw?key=luLiz2GY4XjFT_nYY-mTIQJp" alt=""><figcaption><p><em>The red and green arrows on the chart correspond to the LIQ indicator</em></p></figcaption></figure>

Before diving into the mechanics of the LIQ indicator, it’s essential to understand the factors influencing the cryptocurrency market:

**Long-Term Factors:**

These drive external capital inflows and outflows in the crypto market, determining whether a directional "trend market" develops.

* **BTC Adoption Rate:** The percentage of people outside the crypto space recognizing BTC as a valuable asset. For example, Bitcoin ETFs being approved in 2024.
* **Overall Monetary Market Liquidity:** Factors like U.S. interest rate hikes or cuts, and the expansion or contraction of the balance sheets of major central banks.
* **Crypto-Specific Trends:** Topics that attract external capital, such as DeFi, NFTs, or ICOs.

**Short-Term Factors:**

Short-term market movements are primarily driven by "high-leverage liquidations," leading to a volatile, range-bound market.

* **High Leverage in Derivatives Markets:** Crypto retail investors tend to use high leverage in contracts, making derivatives markets a key tool for market makers to "harvest" retail positions. Hence, short-term price movements are often influenced by derivatives data.
* **Market Maker Perspective:** Market makers evaluate the cost of manipulating prices to liquidate leveraged positions versus the potential profit. They will only act if the potential gains significantly outweigh the costs.

***

## **What is LIQ?**

LIQ is an indicator designed to analyze movements in a volatile market. Below is a detailed breakdown of its logic:

**Core Logic:**

LIQ is a standardized indicator calculated using the ratio of quantities in the spot order book.

* **Order Book Composition:** Comprised of buy orders (*bids*) and sell orders (*asks*).
* **CoinKarma's Proprietary Algorithm:** Standardizes calculations to identify price ranges where the cost of upward or downward movement for market makers is higher.

**Interpretation Logic:**

The LIQ indicator helps assess the cost of upward (*buy up*) or downward (*sell down*) price manipulation by market makers.

* **High LIQ (>3):** Indicates deeper buy orders in the lower order book. This means it’s costlier for market makers to push the price down, suggesting a likely bottom in a volatile market.
* **Low LIQ (<-3):** Indicates deeper sell orders in the upper order book. This makes it costlier for market makers to push the price up, suggesting a likely top in a volatile market.

In simple terms, the LIQ indicator reveals the cost of market maker manipulations. When the cost of price control becomes too high, market reversals are more likely.

## **How to Use the LIQ Indicator**

### **Using LIQ Alone to Identify Entry Points**

If we define the price movements within the white box as a large volatile range, LIQ effectively marks both the range's bottom and top. (Benchmarks: +3, -3)

<figure><img src="https://lh7-rt.googleusercontent.com/docsz/AD_4nXeHKlGtknc8Dk3Lc_Em0SmfJeuXRFhSBdtGKtPEagNdC60MODJqYFYGyvdso_FQSI4XIlkQb3mI92mVnPBXkGHxkBnbvOLUMUwmdhn2MN26BqN3STqXS1MR42yrwwZuNUsj6b9-4g?key=luLiz2GY4XjFT_nYY-mTIQJp" alt=""><figcaption></figcaption></figure>

* **Chart Behavior:**
  * *Green Arrows:* Appear when Overall LIQ > 2 and BTC LIQ > 3.
  * *Red Arrows:* Appear when Overall LIQ < -2 and BTC LIQ < -3.

**Example:**

* After the first green arrow appears in a volatile market, there’s often still significant distance to the actual bottom. This is due to the crypto derivatives market's natural long bias, making liquidating long positions more profitable. Even if the cost of pushing prices lower is high, market makers may continue to do so.
* Conversely, after the first red arrow, the distance to the top is usually shorter than the green arrow's distance to the bottom. Therefore:
  * When green bars appear, gradually build long positions.
  * When red bars appear, close positions more promptly.

### **Using CVD as an Alert for Overextended LIQ**

LIQ is based on order book (limit order) data (*bids* and *asks*). However, when market buy pressure (reflected in rising CVD) is strong, it can cause LIQ to overextend. CVD can be used to filter out trending markets, avoiding short positions in a strongly upward market.

<figure><img src="https://lh7-rt.googleusercontent.com/docsz/AD_4nXezJsotSn0ss729N2crgeaRSGpggXn5qjebd6h_IvNOpi-VmNCBSq7unyQsKByFeDdwkTIMsWuXzBRqf8d7-Ef2zkVDTpI5uSo4dQF41m-ierpmBc5bYnNR4MrdF6hkzEPk-iBKBA?key=luLiz2GY4XjFT_nYY-mTIQJp" alt=""><figcaption></figcaption></figure>

### **Combining LIQ with Other CoinKarma Indicators**

CoinKarma develops multiple indicators to complement LIQ for better trade strategies.

<figure><img src="https://lh7-rt.googleusercontent.com/docsz/AD_4nXczQs6SMtiRla780_3RkdrZiZD0_9GMXNyI6tvo5ca-bHpLidJsmmrjdCK42L7Iv3vaEFzyVZRylcxVO0gbMiwDH8H5jLdliG9Gj3SWoogzc-LEGD0Ot9qYFdvGYK1Q__qxI1OvLQ?key=luLiz2GY4XjFT_nYY-mTIQJp" alt=""><figcaption></figcaption></figure>

Examples:

1. **LIQ + LIQ Accumulated:** Stricter entry/exit conditions, though trading opportunities are fewer.
   * Purple box: LIQ; Yellow box: LIQ + LIQ Accumulated.
2. **LIQ + ALT Resilient Index:** Similar stricter strategy for entries/exits.
   * Purple box: LIQ; Yellow box: LIQ + ALT Resilient Index.

By backtesting with various configurations, users can build LIQ-based trading strategies.

## **LIQ-Derived Indicators**

### **Overall LIQ**

* **Principle:** Same as LIQ but weighted by market cap, representing overall market liquidity.
* **Difference:** LIQ focuses on a single asset (e.g., BTC/USDT), while Overall LIQ represents the broader market, showing the same data across all trading pairs.

Overall LIQ is a market-cap weighted liquidity indicator aggregating all tokens tracked by CoinKarma — it displays the same data regardless of which trading pair you're viewing. Simply put: LIQ measures a single market, Overall LIQ measures the entire market.

* **Application:** Combine LIQ with Overall LIQ for more sensitive and frequent short-term trading signals.

<figure><img src="https://lh7-rt.googleusercontent.com/docsz/AD_4nXe82xXlx0tsiU91qIgV83guHMXBKOQ9_sRkBm6CMBoDMk78CfM9zLW0yiekDf-dsi11iZy9H2HdxUoIFnF4Ayt0sK3_HBNuW0QS6JUxZJo7GJw6_22AaPaTugiKowCIrFj1swV4fA?key=luLiz2GY4XjFT_nYY-mTIQJp" alt=""><figcaption></figcaption></figure>

### **Accumulated LIQ**

* **Principle:** Adds a time dimension to LIQ by accumulating past values.
* **Application:**

  * 1-hour time frame: Default settings (24, 60, -60).

  <figure><img src="https://lh7-rt.googleusercontent.com/docsz/AD_4nXe_bDaJYM1EjEue9vr_FQchQ9p6WKjbEEFdjWNeXIGVJ6Ghs8IFI8UIO1Egr4R0RHmQFUPKKWLSvahLBDnvqgYTh74rYSkTwZ3EXwtiJRSOia--eM0CKgN0N_1MXiWMuDvhUpuZ5Q?key=luLiz2GY4XjFT_nYY-mTIQJp" alt=""><figcaption></figcaption></figure>

  * 4-hour time frame: Default settings (50, 100, -100).

  <figure><img src="https://lh7-rt.googleusercontent.com/docsz/AD_4nXejJn-cZP3-_JAeIAuyo26YJFbQCb-P2kgBn-wVWmhpOSt9Rnjx9oZsgEvqV_LeigbEFmqdUs6v9Ax6o98gKnxfgZoq86iWjKt9k-lxySw0djaM4VSEBHcxQzPMfH1quU2kKekxaA?key=luLiz2GY4XjFT_nYY-mTIQJp" alt=""><figcaption></figcaption></figure>

### **10% Orderbook DIF**

* **Principle:** Measures the difference in bid-ask within the top 10% of the order book.
* **Application:** Helps gauge the liquidity strength of buyers or sellers under identical LIQ conditions.

<figure><img src="https://lh7-rt.googleusercontent.com/docsz/AD_4nXc92vq2XnDd1ZH397fSyH8Cm4TdNlhr9gteACSGk88VwqdyR9aoSZoFwSbKcRzVcmQZBWNGhmD3ZCZDPx7FnZpr2FGmRb-c5ulQKX-A6BX4KgVuJ1MA7Ed0wENm4o2i8qM7IO6T?key=luLiz2GY4XjFT_nYY-mTIQJp" alt=""><figcaption></figcaption></figure>

***

### 10% Overall Liquidity <a href="#id-10-overall-liquidity" id="id-10-overall-liquidity"></a>

Concept: The metric is based on the difference between bids and asks within 10% of the overall market order book. ([Referencing the coins currently included in CoinKarma’s Overall LIQ.](https://docs.coinkarma.co/indicators-guide/liq#overall-liq))

Application: By analyzing the 10% Overall Liquidity, we can observe that—given the same Overall LIQ values—buy-side liquidity in the yellow box is greater than that in the purple box. (Default thresholds are set at 300 million and -300 million.)

<figure><img src="/files/qHWtXZyc1Zem7thhPwxQ" alt=""><figcaption></figcaption></figure>

Overall Liquidity – Displayed in BTC: You can choose to display liquidity in BTC through the indicator settings. (Default thresholds: +3000 BTC, -3000 BTC.)

The logic behind it is: the difference between bids and asks within 10% of the overall market order book, divided by the current BTC price. In a bullish scenario, backtesting has shown that this metric has strong predictive value for price movements.

<figure><img src="/files/ZZK8G1lQ5BcOUL3kLNEZ" alt=""><figcaption></figcaption></figure>

## **Conclusion: LIQ's Strengths and Limitations**

**Applicable Scenarios**

LIQ performs best during range-bound markets with no significant capital inflows or outflows.

**Limitations**

1. **Trend Markets:**\
   LIQ struggles during strong directional trends, as seen in November 2024 when external capital pushed BTC from $67K to $99K.
2. **Macro Factors:**\
   Events like aggressive interest rate hikes in 2022 caused large capital outflows, reducing LIQ's effectiveness.
3. **Asset-Specific Thresholds:**\
   Different assets may require adjusted LIQ benchmarks due to varying market-making styles. Users can fine-tune settings for better accuracy.

***

{% hint style="info" %}

#### **Disclaimer**

Thank you for using CoinKarma. The data provided is based on historical performance and cannot guarantee future market trends. The cryptocurrency market is highly volatile. Users must assess risks and bear responsibility for their decisions.
{% endhint %}


# ALT resilient Index

## What is the ARI Indicator (ALT Resilient Index)?

<figure><img src="https://lh7-rt.googleusercontent.com/docsz/AD_4nXdp3pS7y5T--z3FB7nSfr7Ykk6qGodOVkbTXKnt741GlVKjiB6xGa0kCfW0exK_00gHqxx2P-1evpqIfxKK-gtLFVhFJRuU7VARzkWnDhzZ7ARrwdnAbcAhDcaKHYdpviijgx8L9w?key=luLiz2GY4XjFT_nYY-mTIQJp" alt=""><figcaption></figcaption></figure>

The ARI (ALT Resilient Index) is designed to identify relatively safe entry points during market downturns by analyzing the behavior of altcoins compared to Bitcoin.

**Core Concept**

When Bitcoin (BTC) experiences significant declines but altcoins (ALT) do not follow suit with proportional drops, it often signals a short-term stabilization point. This phenomenon occurs because altcoins are generally more sensitive to selling pressure during market corrections. When the market begins to stabilize, market makers start accumulating the altcoins they previously sold, resulting in a rebound in the ALT/BTC ratio.

The ARI measures the willingness of market makers to absorb selling pressure during extreme market conditions. A higher ARI value indicates a stronger commitment by market makers to support prices, which often coincides with a market bottom.

***

## How to Use the ARI Indicator

**1. Using ARI as a Standalone Entry Signal**

ARI is particularly effective during sharp corrections within bullish market trends, where Bitcoin often experiences drops exceeding 10-20%. During such corrections, the ARI indicator helps identify entry points with higher safety margins.

**Example:**

* **Point A:** BTC correction due to "sell the news" after ETF approval.
* **Point B:** Market turmoil caused by the intensifying Israel-Hamas conflict.
* **Point C:** Japanese central bank's interest rate hike, triggering global financial turbulence.

<figure><img src="/files/uvvplczva2gRQ9e3ySXN" alt=""><figcaption></figcaption></figure>

At each of these events, ARI highlighted relatively low-risk entry points during market fear.

***

### **2. Combining ARI with LIQ for Enhanced Entry Strategies**

The ARI can be used alongside the LIQ (Liquidity Index) to filter entry signals during volatile markets.

**Example:** During the Bank of Japan's unexpected rate hike (July 31), Bitcoin dropped rapidly from 67K to 58K. The LIQ indicator generated an entry signal (yellow box), but the price continued to fall to a low of 49K. By incorporating ARI (orange box) as an additional filter, the safety margin of the entry was significantly improved.

<figure><img src="/files/xueqdf5PUqmfoNv4KpCt" alt=""><figcaption></figcaption></figure>

***

## **Conclusion:** ARI Indicator's Strengths and Limitations

**Strengths**

* **Effective during sharp corrections:** The ARI excels in identifying safe entry points when the market experiences significant pullbacks.

**Limitations**

**Limited Trading Opportunities:** With a benchmark set at 3, ARI signals may trigger infrequently. Users can combine ARI with other indicators to maximize its utility.

<figure><img src="/files/Prv9233A8bs88lV1sCBh" alt=""><figcaption></figcaption></figure>

**Not Guaranteed to Pinpoint Absolute Lows:** While ARI reflects the willingness of market makers to absorb selling pressure, it does not account for all market-driving factors. For example: **January 2024:** During a "sell the news" event for Bitcoin, ARI triggered, but BTC still declined by over 10%. However, in hindsight, the ARI signal still indicated a solid entry zone.

<figure><img src="/files/5GzIgo4ALWUl1C9mdcri" alt=""><figcaption></figcaption></figure>

#### Conclusion

The ARI indicator is a valuable tool for identifying high-safety-margin entry points during major corrections. While it excels in specific scenarios, combining it with other indicators like LIQ can enhance its effectiveness and mitigate its limitations. Users should always evaluate market dynamics holistically and recognize that no single indicator can account for all variables in the highly volatile crypto market.

***

{% hint style="info" %}

#### **Disclaimer**

Thank you for using CoinKarma. The data provided is based on historical performance and cannot guarantee future market trends. The cryptocurrency market is highly volatile. Users must assess risks and bear responsibility for their decisions.
{% endhint %}


# Future Basis Rolling APY

## What is Future Basis Rolling APY?

<figure><img src="/files/LSynls3agzRdkmwmpTqK" alt=""><figcaption></figcaption></figure>

Future Basis Rolling APY refers to the annualized yield derived from the price difference (basis) between futures contracts and spot prices. In the crypto market, futures contracts for most coins often trade at a premium (positive basis) due to the market's long-term bullish sentiment. This creates an arbitrage opportunity.

**Arbitrage Opportunity Explained**

For example:

* Suppose a BTC futures contract has a 2% price premium (basis) compared to the spot price, and the contract expires in 30 days.
* An arbitrageur can **buy BTC in the spot market** and simultaneously **short the futures contract** for the same amount, locking in the 2% price difference.
* By holding both positions until the contract expires, the arbitrageur secures the 2% profit as the prices converge, with minimal risk.

The annualized yield from this trade is calculated as: 2%\*(360/30)=24%<br>

**Why "Rolling"?**

The term "Rolling" refers to the dynamic nature of this APY. As the contract approaches its expiration date, the basis narrows (converges with the spot price), and the APY changes. Traders often roll their positions to new contracts to maintain a steady yield.

## How to Use Future Basis Rolling APY

**Indicator of Market Sentiment**

Just like the funding rate, Rolling APY reflects market sentiment. Higher premiums in futures contracts (and therefore higher APY) suggest optimism, while lower premiums signal fear or bearishness.

From historical data on BTC quarterly futures contracts, Rolling APY can be interpreted as follows:

* **Below 0%:** Extreme pessimism (e.g., March 12, 2020, crash).
* **0-5%:** Severe market fear.
* **5-10%:** Neutral or calm market conditions.
* **10-15%:** Slightly bullish sentiment.
* **15-20%:** Market exuberance.
* **Above 20%:** FOMO-driven speculation.

Default thresholds are typically set between **5% (neutral) and 20% (FOMO)**, but traders may adjust these based on backtesting and current market conditions.

***

## **Conclusion:** Future Basis Rolling APY's Limitations

1. **Market Evolution and Data Sensitivity**
   * Before BTC spot ETFs were approved, institutional investors had limited ways to gain exposure to Bitcoin, making futures contracts a key tool.
   * With the introduction of ETFs, arbitrage between ETFs and futures has become easier, compressing the basis and muting Rolling APY values.
2. **Adjusting Standards**
   * Historical thresholds may no longer apply due to these changes.
   * For instance, a Rolling APY of 15%-20% today may already indicate FOMO conditions, whereas it required 20%+ in the past.

#### Conclusion

Future Basis Rolling APY is a useful metric for understanding market sentiment and identifying arbitrage opportunities. However, as the market structure evolves, traders should regularly reevaluate thresholds and adapt their strategies accordingly. This indicator, when combined with others like funding rates, offers a clearer picture of the market’s state.

***

{% hint style="info" %}

#### **Disclaimer**

Thank you for using CoinKarma. The data provided is based on historical performance and cannot guarantee future market trends. The cryptocurrency market is highly volatile. Users must assess risks and bear responsibility for their decisions.
{% endhint %}


# OI-Weighted Funding Rate

## What is OI-Weighted Funding Rate? (Open Interest-Weighted Funding Rate)

<figure><img src="https://lh7-rt.googleusercontent.com/docsz/AD_4nXcfRoNOwoVujyky-uXV_wJQD5FgElARc-CZeuO1OzlvpMlD_LhzJaqT7GBXJs_1Exn8uxqAJzjAG6l5uCmveKdJtJcKFrm79kJ5aiHAjzG-LNLrb32mT2DuUmXfJkuRUpmImWpxWw?key=luLiz2GY4XjFT_nYY-mTIQJp" alt=""><figcaption></figcaption></figure>

The **OI-Weighted Funding Rate** is an adjusted metric that calculates the weighted average funding rate of BTC perpetual contracts across major exchanges, based on their open interest (OI). It provides a more comprehensive view of market sentiment by accounting for the relative size of positions on different platforms.

**Understanding Funding Rates**

Funding rates are a mechanism used by cryptocurrency exchanges to maintain the price of perpetual contracts in line with the underlying spot price. The funding rate typically consists of:

1. **A constant interest rate (e.g., 0.01%)**, and
2. **A premium component (based on price divergence).**

When perpetual contract prices trade significantly above the spot price:

* **Funding rates increase** to make long positions more expensive.
* This discourages excessive buying and incentivizes long positions to close, bringing prices back down.

Conversely, when perpetual contracts trade below the spot price:

* **Funding rates turn negative**, making short positions costlier.
* This incentivizes short positions to close, bringing prices back up.

***

## How to Use OI-Weighted Funding Rate

**Interpreting Market Sentiment**

Just like **Future Basis Rolling APY**, the OI-Weighted Funding Rate is an indicator of market sentiment.

1. **When the funding rate surges** (indicating perpetual contracts are priced significantly higher than spot prices):
   * Possible Scenarios:
     * **Rising Trend:** Over-leveraged longs drive prices up as traders aggressively open bullish positions.
     * **Falling Trend:** Long traders aggressively attempt to "buy the dip," pushing perpetual prices above spot levels.
   * Implications for Bulls:
     * High funding rates suggest euphoria, often driven by retail traders. Over-leveraged long positions may face liquidations, especially in a downturn.
2. **When the funding rate drops** (indicating perpetual contracts are priced significantly lower than spot prices):
   * Possible Scenarios:
     * **Falling Trend:** Aggressive shorting with high leverage causes perpetual prices to fall below spot.
     * **Rising Trend:** Bears continue shorting despite upward momentum, creating a divergence.
   * Implications for Bears:
     * High leverage among short positions makes them vulnerable to liquidations if the price moves upward.

**Market Behavior and Key Insights**

**High Funding Rates (Perpetual > Spot)**

* **Bullish Overextension**
  * A rising trend with high funding suggests optimism but often leads to volatility as leveraged long positions face liquidation risk.
* **Bearish Reversal Potential**
  * If funding spikes during a downtrend, it may indicate that longs are being squeezed, favoring shorts.

**Low Funding Rates (Perpetual < Spot)**

* **Bearish Overextension**
  * A falling trend with low funding indicates excessive pessimism, often driven by retail shorts.
* **Bullish Reversal Potential**
  * If funding plummets during an uptrend, it signals that shorts are over-leveraged, favoring longs.

## **Conclusion:** OI-Weighted Funding Rate's Limitations

Like the **Future Basis Rolling APY**, the introduction of BTC spot ETFs and other regulated instruments has changed the market dynamics:

* Institutional players can now easily hedge BTC exposure by shorting futures, compressing funding rates.
* This **dampens funding rate volatility**, making historical thresholds less relevant.

**Example Adjustment:**\
Previously, a high funding rate (e.g., 0.1%+) signaled extreme euphoria. Today, lower values (e.g., 0.05%-0.08%) may already indicate over-leveraging.

#### Conclusion

The OI-Weighted Funding Rate provides valuable insights into leverage dynamics and market sentiment. While it reflects extremes in bullish or bearish sentiment, evolving market structures require traders to recalibrate their thresholds and combine this indicator with others to improve accuracy.

***

{% hint style="info" %}

#### **Disclaimer**

Thank you for using CoinKarma. The data provided is based on historical performance and cannot guarantee future market trends. The cryptocurrency market is highly volatile. Users must assess risks and bear responsibility for their decisions.
{% endhint %}


# Bitfinex Indicators

## What Are Bitfinex Indicators?

<figure><img src="/files/bXaU6COOEYHh1gQopiR1" alt=""><figcaption></figcaption></figure>

Bitfinex Indicators are metrics designed to track the behavior of whales (large traders) on the Bitfinex exchange, providing insights into how these "smart money" players view the market. Bitfinex, a veteran cryptocurrency exchange operated by iFinex (also the parent company of Tether, issuer of USDT), is known for its significant whale activity that can influence market trends.

By monitoring these indicators, traders can gain valuable insights into market sentiment and identify potential opportunities during whale accumulation or distribution phases.

***

## How to Use**Bitfinex Indicators**

### **Bitfinex BTCUSD LONGS / Bitfinex ETHUSD LONGS**

These indicators represent the total leverage-based long positions on BTC and ETH in BTC-denominated terms.

* **Whale Behavior:**\
  Whales often avoid aggressive market buys/sells due to their large capital size, which can cause price volatility. Instead:
  * Whales **accumulate during price drops** (when sell-side liquidity is abundant).
  * Whales **distribute during price rallies** (when buy-side liquidity is high).
* **Application:**
  * During sharp market declines, check whether whales are accumulating. For instance, during the 2022 bear market, BTC dropped below $35K after the LUNA collapse, prompting significant whale buying that lasted until $16K.
  * Watch for whales completing their distribution phases. For example, by March 2024, whales had offloaded most of their positions established during the 2022 bear market. Following BTC's peak of $73K, the market entered a prolonged consolidation phase, with BTC dipping below $50K in August 2024 before whales resumed accumulation.

<figure><img src="/files/FXIMZrNhZuL2cojplpoY" alt=""><figcaption></figcaption></figure>

***

### **Bitfinex Margin Long Size**

This indicator measures the total leveraged USD/USDT borrowing positions on Bitfinex.

* **Relationship with BTCUSD LONGS:**\
  Similar to BTCUSD LONGS, it reflects whale behavior during accumulation and distribution phases. However, it tends to exhibit **greater sensitivity**, making it a useful early warning indicator.

<figure><img src="/files/unXddtVgNCqiJy8os6oc" alt=""><figcaption></figcaption></figure>

***

### **Bitfinex Premium**

The Bitfinex Premium compares BTCUSD prices on Bitfinex versus Coinbase.

* **Interpretation:**
  * When **Bitfinex BTCUSD is at a premium to Coinbase**, it indicates bearish sentiment, with whales accumulating during downturns.
  * When **Bitfinex BTCUSD trades at a discount to Coinbase**, it signals bullish sentiment, as whales offload positions during uptrends.
* **Threshold Example:**
  * Premium/Discount exceeding ±0.25% often coincides with market tops or bottoms.

<figure><img src="/files/7T4epdNfRQS34ZfThIyT" alt=""><figcaption></figcaption></figure>

***

### **Bitfinex ETH/BTC Whale Indicator**

This indicator tracks the net long leveraged positions in ETH/BTC pairs.

* **Interpretation:**
  * A high indicator value suggests whales are borrowing BTC to long ETH, indicating bullish ETH sentiment relative to BTC.
  * Conversely, a decline in this indicator signals whales closing ETH longs, often coinciding with ETH/BTC exchange rate peaks.
* **Application:**
  * Example: After whales closed significant ETH/BTC long positions, the ETH/BTC ratio often peaked, signaling a potential shift from ETH to BTC as a safer allocation.

<figure><img src="/files/FSEdqXM4c0TlUzDxPnSo" alt=""><figcaption></figcaption></figure>

***

## **Conclusion: Bitfinex Indicators**'s Strengths and Limitations

**Best Use Cases:**

* These indicators are ideal for **medium to long-term market analysis**.
* They help traders understand whale behavior and market sentiment trends over longer cycles.

**Limitations:**

* Whale trading strategies on Bitfinex involve **large-scale, prolonged accumulation and distribution**, making these indicators less effective for short-term or intraday trading.
* As a result, retail traders should combine Bitfinex Indicators with other CoinKarma tools and indicators to refine their strategies.

#### **Conclusion**

Bitfinex Indicators provide a unique perspective into the behavior of smart money, helping traders align their strategies with whale sentiment. While they are less suitable for short-term trades, these metrics can offer valuable insights into broader market cycles when used alongside other analysis tools.

***

{% hint style="info" %}

#### **Disclaimer**

Thank you for using CoinKarma. The data provided is based on historical performance and cannot guarantee future market trends. The cryptocurrency market is highly volatile. Users must assess risks and bear responsibility for their decisions.
{% endhint %}


# Karma Index

## **What Is the Karma Index?**

<figure><img src="/files/6L4wQ9uYu4L8Jp6KNO9O" alt=""><figcaption></figcaption></figure>

The **Karma Index** is a comprehensive indicator designed to identify cyclical market tops and bottoms in cryptocurrency trading. It combines data from various sources, including:

* **Spot market liquidity**
* **On-chain metrics**
* **Off-market sentiment**
* **Exchange traffic**
* **Derivatives market data**

By quantifying these factors, the Karma Index provides a reliable tool for traders to pinpoint the relative highs and lows of major market cycles.

#### **The Challenge: Defining Highs and Lows**

The fundamental strategy for success in trading is “**buy low, sell high.**” However, determining what constitutes “low” and “high” is the core challenge for any trader.

In an upward-trending market, each cycle tends to establish higher lows and higher highs.

* **Low points** are defined as **cycle bottoms**, where sentiment is excessively bearish.
* **High points** are **cycle tops**, characterized by market euphoria.

As the saying goes:

> *“Buy when there’s no interest, sell when there’s a frenzy.”*

Yet, these psychological turning points are notoriously difficult to act upon due to fear at the bottom and greed at the top.

#### **Features of the Karma Index**

The Karma Index stands out for its dual strengths:

1. **Cyclical Awareness**: Accurately identifies the larger market cycles.
2. **Precision**: Generates clear buy and sell signals that outperform other mainstream indicators.

***

## **How to Use the Karma Index**

The Karma Index is optimized for **long-term cycle analysis**, focusing on major market movements.

* **Macro Cycle: The 2019–2021 Bull-Bear Cycle**\
  During this cycle, even with the **March 12, 2020, event**, there was no panic selling of holdings. Instead, positions were steadily held until reaching the phase high in 2021.

<figure><img src="/files/GVURk5HQQVdy0hSFHBzT" alt=""><figcaption></figcaption></figure>

* **Within-Cycle: Accumulation Opportunities in the 2019–2021 Bull-Bear Cycle**\
  Point B was a low in the Karma Index during this cycle and corresponded to Point A, which had the same Karma Index value. Afterward, BTC reached new highs.\
  Looking back, Point B was at the tail end of consolidation following the **May 19 crash**, making it an excellent entry point.

<figure><img src="https://lh7-rt.googleusercontent.com/docsz/AD_4nXcq_oItOQU8y_K-caPWcfWvw-jAe3DehkjIt7PtiLVui8rOqifOps2iCmLDAFwXQM_R3oM7-EWbaRYRa0o8CtWhcyOtvViItJCGmqxLC1i-c7wjf7z3ENOiJPk2Q_B9j5V3mxAcLw?key=luLiz2GY4XjFT_nYY-mTIQJp" alt=""><figcaption></figcaption></figure>

* **Macro Cycle: The 2022–2024 Bull-Bear Cycle**\
  The **FTX bankruptcy event in November 2022** caused BTC to drop to a cycle low of 16K. During this period, the Karma Index provided a clear entry signal, enabling holders to ride the trend steadily to the phase high of 73K.

<figure><img src="https://lh7-rt.googleusercontent.com/docsz/AD_4nXcVwhkxh0D6Vm1N2Uh20WPWPMCIN3vSlRqmglPSqYTUfiVIQuN2ISX9lAB4bKM5Xi-lkuS7CUGEn0VNamZp-VTeVN8OINUr905bQWNCyF5W2IheIdjEevaYmV23QLmc8ciwR1Bg6A?key=luLiz2GY4XjFT_nYY-mTIQJp" alt=""><figcaption></figcaption></figure>

* **Within-Cycle: Accumulation Opportunities in the 2022–2024 Bull-Bear Cycle**\
  Point B was a low in the Karma Index during this cycle and corresponded to Point A, which had the same Karma Index value. Afterward, BTC reached new highs.\
  Looking back, Point B was precisely at the starting point of the Q4 bull market, making it an excellent entry point.

<figure><img src="https://lh7-rt.googleusercontent.com/docsz/AD_4nXfBZGMQJVUKmNTT6PJuW31B19G8U-iOBAnJtg2qdb6e451bmHXdT2ZlsgIkSBCxa1hgeKmmj5oYQ-f0ZH79Tk6RTtpuS0yWVFsZVmJ8pB-Ftf82zsDXE1Ko3j-7cuAGFeIAsQeU?key=luLiz2GY4XjFT_nYY-mTIQJp" alt=""><figcaption></figcaption></figure>

***

**Cyclical Nature**

* The **green arrows** in the historical chart represent **buy signals**, typically occurring at global cycle bottoms.
* The **red arrows** indicate **sell signals**, correlating with cycle peaks.
* The pattern demonstrates that frequent buy signals tend to align with bottoming phases, while sell signals coincide with market tops, validating the **cyclical reliability** of the index.

**Precision**\
Backtesting the Karma Index against other popular cyclical indicators—**AHR999** and **Crypto Greed & Fear Index**—reveals its superior accuracy in buy/sell signals.

<figure><img src="/files/F1qvEeP3UguXxMCWe49k" alt=""><figcaption><p>Allocate <strong>10% of capital</strong> on each buy signal, Close <strong>50% of positions</strong> on each sell signal.</p></figcaption></figure>

#### **Backtesting Results: Karma Index vs. Other Indicators**

| **Indicator**       | **ROI**     | **MDD (Max Drawdown)** |
| ------------------- | ----------- | ---------------------- |
| **Karma Index**     | **1917.4%** | **62.5%**              |
| AHR999              | 478.7%      | 35.4%                  |
| Crypto Greed & Fear | 54.2%       | 71.5%                  |

* **ROI (Return on Investment):** The Karma Index delivered a staggering **1917.4%**, far exceeding other indicators.
* **MDD (Max Drawdown):** While slightly higher than AHR999, the Karma Index maintained a tolerable drawdown, outperforming Crypto Greed & Fear significantly.

***

{% hint style="info" %}

#### **Disclaimer**

Thank you for using CoinKarma. The data provided is based on historical performance and cannot guarantee future market trends. The cryptocurrency market is highly volatile. Users must assess risks and bear responsibility for their decisions.
{% endhint %}


# Exchange App iOS Ranking

## What is the Exchange App iOS Ranking?

The iOS App Ranking tracks download rankings of centralized exchange apps in the U.S. market.

During quiet market periods, many people gradually exit the market, resulting in decreased attention. However, when the market enters a frenzy, hearing stories of others making money draws people back in droves—even those with no prior interest, like kids shining shoes, seek ways to enter the market. This phenomenon is commonly referred to as the "Shoeshine Boy Effect."

By observing the download rankings of the Coinbase app, it’s possible to gauge whether the Shoeshine Boy Effect is occurring. When the app ranks among the top few, it signifies a highly exuberant market with widespread interest in joining, and vice versa.

***

## How to Use the Exchange App iOS Ranking

The blue line in the indicator represents Coinbase’s ranking within the Finance category of iOS apps in the U.S. A lower value indicates a higher rank. When the Coinbase app climbs higher in the rankings, it reflects a stronger retail interest in crypto in the U.S. market. If the app ranks within the Top 10, surpassing traditional finance apps like Interactive Brokers or Yahoo Finance, it could signal a short-term overheated market, as most retail participants have already entered.

Looking back at past bull markets, when Coinbase consistently ranked in the Top 10 for an extended period, it often marked a local market top. The longer the rankings stayed elevated, the more likely it was that the trend was approaching a global peak. The chart below uses a Top 10 threshold as a reference, reviewing the bull markets of 2021 and 2024 for readers’ insights.

<figure><img src="/files/XbeXsEaO0blky7KW6MQA" alt=""><figcaption></figcaption></figure>

***

{% hint style="info" %}

#### **Disclaimer**

Thank you for using CoinKarma. The data provided is based on historical performance and cannot guarantee future market trends. The cryptocurrency market is highly volatile. Users must assess risks and bear responsibility for their decisions.
{% endhint %}


# USD/USDT Interest Rate

## What is the USD/USDT Interest Rate?

In addition to crypto-native features like perpetual contracts and funding rates, the crypto market also includes borrowing interest rates commonly seen in traditional finance. These rates are generated by spot borrowing activities on centralized exchanges. There are two key elements to analyze: the centralized exchange and the interest rate levels. Currently, the benchmark data comes from Binance, the world’s largest exchange, and Bitfinex, a long-standing platform renowned for lending activities.

**● Binance**

As the world’s largest exchange, Binance has a more diverse user base, with a relatively high proportion of retail traders. This composition often leads to more aggressive behavior during periods of price discovery or bull markets.

**● Bitfinex**

Bitfinex, one of the oldest exchanges, is characterized by its seasoned user base, often consisting of crypto-native whales. Observing Bitfinex’s borrowing interest rates can provide insights into how so-called “smart money” perceives current market conditions.

***

## How to Use the USD/USDT Interest Rate

The USD/USDT Interest Rate is a highly cyclical indicator. Given the differing characteristics and user bases of the two exchanges, Binance’s borrowing behavior is viewed as representative of retail traders, while Bitfinex’s behavior reflects that of market movers.

Key observations:

* When **Bitfinex’s borrowing rate > Binance’s borrowing rate**, it often signals a market bottom.
* When **Bitfinex’s borrowing rate < Binance’s borrowing rate**, it often signals a market top.

***

{% hint style="info" %}

#### **Disclaimer**

Thank you for using CoinKarma. The data provided is based on historical performance and cannot guarantee future market trends. The cryptocurrency market is highly volatile. Users must assess risks and bear responsibility for their decisions.
{% endhint %}


# Binance Insurance Fund

## What is the Binance Insurance Fund (Contract Risk Protection Fund)?

According to Binance's documentation:

**Definition**

The Contract Risk Protection Fund is a safeguard mechanism designed to limit the impact of counterparty liquidations. It protects traders from adverse losses caused by bankrupt positions and ensures that profits from winning positions are fully paid out to the profitable traders.

**Source of Funds**

When a position is liquidated, unless the position becomes a bankrupt one after liquidation, the remaining assets (after deducting the portion required to maintain the position) are charged as liquidation fees by Binance. A portion of these fees is allocated to the Contract Risk Protection Fund.

#### Key Insights

Perpetual contracts operate as a zero-sum market: for every gain, there is a corresponding loss. During extreme market conditions, if the losing side's margin is insufficient to fully cover the profits of the winning side, the Binance Insurance Fund steps in to make up the difference. Therefore, the Insurance Fund typically decreases only after extreme leveraged liquidations occur.

***

## How to Use the Binance Insurance Fund

The Binance Insurance Fund tends to grow steadily over time. It decreases only during events of massive liquidations that result in user bankruptcies. When the Insurance Fund decreases, it indicates excessive short-term liquidations have occurred.

This is particularly effective when analyzing leveraged long positions:

* A decrease in the Binance Insurance Fund often suggests a market that has been excessively cleared out, which may signal a **short-term bottom**.

<figure><img src="/files/8sOnJKWPPKT7XkyKvEBn" alt=""><figcaption></figcaption></figure>

***

{% hint style="info" %}

#### **Disclaimer**

Thank you for using CoinKarma. The data provided is based on historical performance and cannot guarantee future market trends. The cryptocurrency market is highly volatile. Users must assess risks and bear responsibility for their decisions.
{% endhint %}


# CVD(Cumulative Volume Delta)

## What is CVD (Cumulative Volume Delta)?

CVD is an indicator used to analyze the balance of buying and selling pressure in the market. It accumulates the volume difference between buy and sell orders over a given time period.

In simple terms, CVD reflects the "market order" buying and selling strength during a specific trend.

#### Why Does CoinKarma Include the CVD Indicator?

CoinKarma features CVD because its LIQ-related indicators are based on bid (buy) and ask (sell) orders from the spot order book—essentially composed of "limit orders." However, when "market orders" consistently drive price movement in one direction during a trend, they can deplete most of the "limit orders," causing LIQ-related data to show excessive extension.

***

## How to Use CVD

This section focuses on comparing CVD with instances of LIQ overextension to demonstrate how CVD can filter out such scenarios.

**Example:**\
In cases where Overall LIQ red bars appear excessively (as marked by the yellow boxes), prices often continue to reach new highs. Observing the CVD during these periods reveals strong market buying activity, which consumes a significant amount of sell (ask) limit orders. This depletion leads to LIQ overextension.

By analyzing CVD, traders can identify these scenarios and avoid taking short positions during such periods.

<figure><img src="/files/BNdIrtumViAHff5hcvMy" alt=""><figcaption></figcaption></figure>

***

{% hint style="info" %}

#### **Disclaimer**

Thank you for using CoinKarma. The data provided is based on historical performance and cannot guarantee future market trends. The cryptocurrency market is highly volatile. Users must assess risks and bear responsibility for their decisions.
{% endhint %}


# CME Smart Money

## What is CME Smart Money?

In the market, certain whales have enough holdings to significantly influence prices. When these entities buy, they provide strong buying support. Beyond their market impact, information asymmetry has always been a cornerstone of profitability in trading. Observing whales that likely possess this informational edge can help forecast potential market trends.

In 2024, around the approval of the BTC ETF, the market narrative largely revolved around this event. During that period, the Chicago Mercantile Exchange (CME) became the most accessible platform for U.S. traditional financial traders to trade BTC.

CME Smart Money is an indicator derived by identifying specific groups of traders on CME whose position changes have historically shown alpha in market trends.

***

## How to Use CME Smart Money

* **Unit:** Contracts; one contract equals 5 BTC.
* **Reading:** Above the zero line indicates net long positions; below the zero line indicates net short positions.
* **Update Cycle:** Data updates every Saturday (UTC+8), reflecting the positions as of the preceding Tuesday.

From 2022 to 2023, whenever CME Smart Money shifted to a net short position, it often marked a local market top.

<figure><img src="/files/qpz68VWdyzlSViaruZkp" alt=""><figcaption></figcaption></figure>

\
In October 2024, CME Smart Money increased positions from 1,800 to 12,000 contracts, marking the largest holdings and addition of contracts in recorded data. Following this, BTC entered a one-sided rally, surpassing the $100K milestone.

<figure><img src="/files/V70xpqLpquoXiOxzj7s9" alt=""><figcaption></figcaption></figure>

***

{% hint style="info" %}

#### **Disclaimer**

Thank you for using CoinKarma. The data provided is based on historical performance and cannot guarantee future market trends. The cryptocurrency market is highly volatile. Users must assess risks and bear responsibility for their decisions.
{% endhint %}


# BTC ETF Net Flow

## What is BTC ETF Net Flow?

BTC ETF Net Flow measures the net inflows (or outflows) of U.S.-listed BTC ETFs. CoinKarma tracks the daily net flow data for 10 BTC ETFs traded in the U.S. market.

CoinKarma includes this indicator because historical analysis reveals that a portion of BTC ETF inflows originates from arbitrage trades, which have limited direct impact on price trends. This challenges the intuitive notion that net inflows signal bullishness, while net outflows signal bearishness. Instead, BTC ETF Net Flow can provide insights into sentiment in the futures market.

***

## How to Use BTC ETF Net Flow

The following illustrates how U.S. investors use BTC ETFs for arbitrage:

* **When market sentiment is bullish (overheated):** Futures premiums rise, prompting arbitrage traders to buy BTC ETFs while shorting CME futures.
* **When market sentiment is bearish (fearful):** Futures premiums decline, leading arbitrage traders to sell BTC ETFs and close their CME shorts.

**Observation:**\
At market tops, CME open interest typically spikes (corresponding to hedge funds increasing net short positions). After sharp market corrections, CME open interest declines alongside the market.

These arbitrage traders don’t need to wait until futures expire to close their positions. They profit by shorting during market FOMO and closing their shorts during panic sell-offs as market sentiment oscillates.

#### IBIT and Arbitrage Behavior

IBIT, due to its investor profile and lower fees, is particularly favored by arbitrage traders. While other ETFs exhibit similar behavior, their scale is far smaller compared to IBIT. By comparing IBIT’s net flows with BTC price movements, we observe that:

* **Net outflows or a halt in inflows of IBIT funds** (indicating short positions being closed and ETF holdings being sold) often coincide with **short-term market bottoms**.

<figure><img src="/files/e5a0yyzmcYeaYwYC0FvW" alt=""><figcaption></figcaption></figure>

***

{% hint style="info" %}

#### **Disclaimer**

Thank you for using CoinKarma. The data provided is based on historical performance and cannot guarantee future market trends. The cryptocurrency market is highly volatile. Users must assess risks and bear responsibility for their decisions.
{% endhint %}


# Stablecoin Supply

## What is Stablecoin Supply?

Stablecoin Supply refers to the circulating market capitalization of stablecoins such as USDT and USDC.

***

## How to Use Stablecoin Supply

#### By comparing the market capitalization of the largest stablecoin, USDT, with the price of BTC:

• In 2022, as the market declined, USDT’s market cap also decreased → indicating funds flowing out of the market and a continuous reduction in market liquidity.

• Conversely, as the market began to recover in 2023-2024, USDT’s market cap increased → signaling funds flowing into the market and a steady increase in market liquidity.

<figure><img src="https://lh7-rt.googleusercontent.com/docsz/AD_4nXepJcCldLtoXiLwYqWpgsHegk4GW8g8aOKrtbLG33-nECvw7hOmtAr7rvxaWte5eQgfGvj6F24u2QGWIsTRexG5rSoiPHudrcm0L7tEIZ3EB7n-6dLzQB7ccXa644mIuaiP9waysQ?key=luLiz2GY4XjFT_nYY-mTIQJp" alt=""><figcaption></figcaption></figure>

#### Key Observation: USDC’s Counter-Trend Issuance

Analysis reveals that when USDC experiences counter-trend issuance, diverging from price movements, it may signal a market bottom. For example:

• When Overall LIQ shows green bars combined with a USDC issuance exceeding $1 billion, this often forms a short-term range bottom in the market.

<figure><img src="https://lh7-rt.googleusercontent.com/docsz/AD_4nXcsbvGJaYjL1JXDvyGe3A_GlDis_J6rI5p3FzDDx8DnHHRaSG0kEQT6sodHXPb6P0gniZtYqSDWkadxBMw9F37H1OBggdhaB3m5qnTu6awt2LicaszU67YKN-AYci-f6njXwvj9hA?key=luLiz2GY4XjFT_nYY-mTIQJp" alt=""><figcaption></figcaption></figure>

***

{% hint style="warning" %}

#### **Disclaimer**

Thank you for using CoinKarma. The data provided is based on historical performance and cannot guarantee future market trends. The cryptocurrency market is highly volatile. Users must assess risks and bear responsibility for their decisions.
{% endhint %}


# LSUR Z Index

### What is the LSUR Z Index <a href="#shen-mo-shi-lsurzindex" id="shen-mo-shi-lsurzindex"></a>

The LSUR Z Index represents the weighted LSUR (Long/Short User Ratio) of major cryptocurrencies based on open interest, measured in terms of how many standard deviations it deviates from its 14-day average. For example, a value of -2 means it’s two standard deviations below the average.

(*Note: LSUR refers to the ratio of long to short positions in perpetual futures contracts.*)

Historically, in the crypto market, an LSUR below 1 indicated that more traders were shorting than longing—typically a sign of overly pessimistic market sentiment. This often marked a potential market bottom, making it a common short-term reversal signal. However, in recent years, this relationship has broken down or even reversed. An LSUR below 1 can now sometimes precede short-term market tops.

The exact reason remains unclear, but CoinKarma hypothesizes that the structural shift is due to the influx of institutional capital and their hedging strategies. Unlike retail investors, institutions often hold large spot positions and hedge them by opening short positions in futures—not necessarily because they’re bearish, but as a risk management tactic. As a result, an LSUR below 1 may no longer reflect extreme bearish sentiment, but rather strategic positioning.

Despite these changes, LSUR still provides valuable insights. Using CoinKarma’s proprietary algorithms, the LSUR Z Index remains a useful tool for gauging short-term market direction.

### How to use LSUR Z Index <a href="#ru-he-yun-yong-lsurzindex" id="ru-he-yun-yong-lsurzindex"></a>

The LSUR Z Index is best interpreted in conjunction with other CoinKarma indicators. Examples include:

● Spotting Potential Reversal Points with Overall LIQ

In a ranging market, when the LSUR Z Index and Overall LIQ show aligned signals, it can indicate a possible trend reversal.

<figure><img src="https://docs.coinkarma.co/~gitbook/image?url=https%3A%2F%2Flh7-rt.googleusercontent.com%2Fdocsz%2FAD_4nXeiUAmf97NCa1gCl_ACrqQpjjK7oAA1erinkCVILwnsmJEdZAQNSsoXdXaU6pAz_CkNZghr-_TZuS66-QM7c-L3KvJBYQa86A9lxLMh49GrXLz8SEoCwf9xIGzrm1wamx8fxx0kPw%3Fkey%3DluLiz2GY4XjFT_nYY-mTIQJp&#x26;width=768&#x26;dpr=4&#x26;quality=100&#x26;sign=dd27ac76&#x26;sv=2" alt=""><figcaption></figcaption></figure>

● Identifying Overextended Conditions with LIQ Indicators

* Yellow Box: When both LIQ-related indicators and the LSUR Z Index suggest a potential pullback but the price remains strong, this implies that previously effective reversal signals are weakening. This could be a sign that the market is transitioning from range-bound to trending, and shorting should be avoided.
* Purple Box: When the LSUR Z Index drops below -2, use it alongside LIQ indicators to filter out noise and avoid making decisions based solely on LSUR Z Index readings.

<figure><img src="https://lh7-rt.googleusercontent.com/docsz/AD_4nXeXR3hDJmv7QVoxYa_QSB-qZotxhDFoC9k7WMFXVgMu-dHelxpun4lUFYbGQKlKE5PSZj-WofTz3tkOl-2I8SrnrpHx8ktIAdu6u2DevrfX4OKZhyrR_JWMST6_nnjfd2e2awBq?key=luLiz2GY4XjFT_nYY-mTIQJp" alt=""><figcaption></figcaption></figure>

{% hint style="info" %}

#### **Disclaimer**

Thank you for using CoinKarma. The data provided is based on historical performance and cannot guarantee future market trends. The cryptocurrency market is highly volatile. Users must assess risks and bear responsibility for their decisions.
{% endhint %}


# Cumberland USDT Distribution

## Waht is Cumberland USDT Distribution

<figure><img src="/files/mTQWuvUvUEZZj2IMORW2" alt=""><figcaption></figcaption></figure>

## About Cumberland&#x20;

### Company&#x20;

* Company: Cumberland DRW (“Cumberland”), the crypto trading division of DRW Holdings.
* Parent: DRW is a Chicago-based proprietary trading firm founded in 1992.
* Crypto Focus: Cumberland was launched in 2014 and is one of the earliest institutional players in the digital asset market.

### Core Businesses

* OTC Trading – Facilitates large crypto transactions for institutions, miners, foundations, and family offices, minimizing slippage and market disruption.
* Liquidity Provision – One of the largest liquidity providers in crypto, acting as a market maker across major exchanges such as Binance, OKX, and Coinbase.

### Why Track Cumberland?

* Key USDT Gateway: Cumberland is a primary partner of Tether Treasury, frequently handling newly minted USDT and distributing it to exchanges or institutional clients.
* Not All Mints Equal: USDT issuance doesn’t always mean new inflows into crypto; some funds may be used for settlements, off-exchange transactions, or gray-market activity. CoinKarma monitors Cumberland’s wallets in real time to determine whether fresh USDT is actually entering exchanges and driving buy-side pressure.
* Market Impact: Historical data shows that major USDT inflows via Cumberland—such as in early 2024, late 2024, and mid-2025—preceded strong market rallies, highlighting its influence on liquidity cycles.

## How to Use Cumberland USDT Distribution

* A red box marks when Cumberland’s 7-day cumulative USDT transfers exceed $500M.
* Logic: If a large USDT mint is quickly funneled to exchanges, it often fuels taker-buy demand over the next 1–2 weeks. After such an event, the effectiveness of LIQ red bars (bearish liquidity signals) tends to weaken, making premature shorts riskier.

**Case Review with Overall LIQ**\
On the daily chart, highlight candles at points where Cumberland’s 7-day inflows exceed $500M.

<figure><img src="/files/pKIQTZaOYrQ9QNESi3EI" alt=""><figcaption></figcaption></figure>

On the hourly chart, compare these red-box periods with LIQ signals. Example: after significant inflows (points ① and ②), markets continued to rally despite LIQ red bars suggesting resistance.

<figure><img src="/files/pCCu2K1tgsP3xJr4Gx96" alt=""><figcaption></figcaption></figure>

## Indicator Value

* LIQ red bars: Reliable short signals during choppy or sideways markets.
* Problem: In strong uptrends, they often trigger early shorts that get squeezed.
* Solution: Combine LIQ with Cumberland USDT Distribution to filter signals. When large inflows support the market, fade LIQ shorts and avoid false bearish setups.

{% hint style="info" %}

#### **Disclaimer**

Thank you for using CoinKarma. The data provided is based on historical performance and cannot guarantee future market trends. The cryptocurrency market is highly volatile. Users must assess risks and bear responsibility for their decisions.
{% endhint %}


# BTC 25Δ Skew

## Waht is BTC 25Δ Skew

25Δ Skew measures the difference in implied volatility (IV) between put and call options with the same delta magnitude (±0.25)：

<figure><img src="/files/fGVkbYjzphJJeEIHpPRU" alt=""><figcaption></figcaption></figure>

**Key terms**

* IV (Implied Volatility): The market’s expectation of future price variability, embedded in option prices.
* ATM (At-The-Money): The IV of options whose strike is closest to the current spot price; often used as a normalization anchor for comparing vol levels across maturities or strikes.

### 📘 Why “25Δ”?

“25Δ” denotes options with delta ≈ ±0.25—i.e., out-of-the-money (OTM) options a step away from spot.

* 25Δ Put: Slightly below spot; proxies demand for downside hedging.
* 25Δ Call: Slightly above spot; proxies willingness to pay for upside exposure.

Comparing the IV of these two strikes reveals the market’s directional bias and risk appetite.

### 📊 How to Read BTC 25Δ Skew

<table data-header-hidden><thead><tr><th width="125.51953125"></th><th width="208.41796875"></th><th></th></tr></thead><tbody><tr><td>Skew </td><td>Interpretation</td><td>Market Sentiment</td></tr><tr><td>> 0</td><td>Put IV > Call IV</td><td>Fearful; hedging demand elevated (bearish bias)</td></tr><tr><td>&#x3C; 0</td><td>Call IV > Put IV</td><td>Optimistic; strong appetite for upside/chasing rallies (bullish bias)</td></tr></tbody></table>

### Extreme sentiment zones（1M Tenor Example）

<figure><img src="/files/yQq1kOqBiOZbjnXQKDDm" alt=""><figcaption></figcaption></figure>

### 📈 BTC 25Δ Skew Practical Interpretation

#### Skew < −8 → Excessive bullishness (call enthusiasm overheated)

* When call IV is materially higher than put IV, the market is broadly betting on upside.
* &#x20;In December 2024, BTC rallied sharply and the 25Δ skew dipped below −8 multiple times—an expression of exuberant sentiment. Such phases often carry elevated short-term risk and are prone to pullbacks.

#### Skew > +8 → Acute fear (put-hedging demand surges)

* When put IV far exceeds call IV, hedging demand and fear dominate.
* In early April 2025, skew printed above +8 repeatedly amid heightened macro headlines, reflecting a rush for protection. These episodes often coincide with sentiment “bottoms,” but price reversal still needs confirmation from structure/price action.

> Note： In crypto, extreme sentiment can persist. A skew below −8 does not imply an immediate top, and a skew above +8 does not guarantee an immediate bottom. Skew should complement—not replace—other signals.

## How to BTC 25Δ skew

BTC 25Δ Skew is a sentiment gauge, not a standalone trading signal. It helps you:

* Identify when fear/greed reaches extremes that often precede price turning points.
* Contextualize risk: combine skew with price structure, breadth/liquidity metrics, funding/basis, and momentum to refine entries and exits.

#### **Skew = IV(Put) − IV(Call)**

Skew > 0 (positive): Put IV > Call IV → crowd is paying up for downside protection → sentiment fearful.

* Markets can rebound as panic becomes crowded, but wait for confirmation (e.g., momentum/market-structure turns).

Skew < 0 (negative): Call IV > Put IV → crowd is paying up for upside exposure → sentiment optimistic.

* Markets can stall or mean-revert after excessive optimism; again, seek confirmation before acting.

## How to Read BTC 25Δ Skew

<table><thead><tr><th width="103.17578125">Skew </th><th width="247.109375">Interpretation</th><th width="170.2734375">Extreme Threshold</th><th>Interpretation at Extreme</th></tr></thead><tbody><tr><td>Skew > 0</td><td>Put IV > Call IV → market fear; bearish bias</td><td>Skew > 8</td><td>Extreme fear</td></tr><tr><td>Skew &#x3C; 0</td><td>Call IV > Put IV → market optimism; bullish bias</td><td>Skew &#x3C; -8</td><td>Extreme optimism</td></tr></tbody></table>

Time-Period (Tenor) Baseline: 1M

“Time Period” here refers to the option maturity used for comparison.

* Very short-dated (e.g., 1-day): Hyper-sensitive to headlines; captures immediate fear/greed.
* Long-dated (e.g., 1-year): Smoother; reflects expectations for the broader trend.

  Using 1-month as the baseline balances responsiveness with stability for most tactical reads.<br>

## BTC 25Δ skew's limitation

BTC 25Δ Skew reflects market sentiment, not absolute buy/sell instructions. When skew reaches extremes, use it alongside other indicators (price action, liquidity, macro catalysts, positioning) to more reliably identify inflection points.

{% hint style="info" %}

#### **Disclaimer**

Thank you for using CoinKarma. The data provided is based on historical performance and cannot guarantee future market trends. The cryptocurrency market is highly volatile. Users must assess risks and bear responsibility for their decisions.
{% endhint %}


# Volatility Term Structure

## What is Volatility Term Structure

The volatility term structure describes how at-the-money (ATM) implied volatility (IV) varies across option expiries (tenors). Put simply, it compares the relative levels of short-, mid-, and long-dated ATM IV to gauge how the market’s expectations for future volatility are shifting.

### Normal vs. Inverted Structures

#### Normal (upward-sloping):

* Long-dated ATM IV > Short-dated ATM IV
* Longer horizons embed more uncertainty, so the market usually assigns higher forward volatility to longer expiries.

#### Inverted (downward-sloping):

* Short-dated ATM IV > Long-dated ATM IV
* An inversion signals the market expects outsized movement in the near term—often around periods of extreme sentiment (e.g., just before a crash or ahead of a bottoming reversal).

### A Note on Implied Volatility (IV)

In options markets, IV reflects the market’s expectation for the magnitude of future price moves in the underlying.

* High IV → the market anticipates large moves; uncertainty is elevated.
* Low IV → the market expects calmer conditions; uncertainty is subdued.<br>

Among the various IV measures, ATM IV is watched most closely because it best captures the market’s “baseline” view of future volatility.<br>

### How to Use the Volatility Term Structure

Practitioners typically compare ATM IV across three time frames:

* Short term: 1-month ATM IV
* Mid term: 3-month ATM IV
* Long term: 6-month ATM IV

### Key Configurations

<table data-header-hidden><thead><tr><th width="151.8359375"></th><th width="155.9921875"></th><th></th><th></th></tr></thead><tbody><tr><td>Setup</td><td>Context</td><td>Market Interpretation</td><td>Volatility Expectation</td></tr><tr><td>① 1M &#x3C; 3M &#x3C; 6M</td><td>Normal structure</td><td>The market is steady; long-term uncertainty is higher than short-term.</td><td>Volatility expected to be stable.</td></tr><tr><td>② 1M > 3M > 6M</td><td>Fully inverted</td><td>The market expects pronounced near-term turbulence.</td><td>Intense short-term volatility likely; often seen before crashes or ahead of bottom reversals.</td></tr><tr><td>③ 1M ≈ 3M ≈ 6M</td><td>Completely flat</td><td>The market lacks a clear directional view and is waiting for a catalyst.</td><td>Typically the calm before a volatility breakout.</td></tr></tbody></table>

#### Post-Trade / Backtest Takeaways

<figure><img src="/files/uytEOoNlpJ8ZtnL2snj0" alt=""><figcaption></figcaption></figure>

From the illustrative chart: when the orange line (1M ATM IV) rises above the blue and purple lines (3M and 6M ATM IV)—i.e., an inversion—the VTS panel highlights these periods in red. These episodes often line up with phases when the BTC market is about to experience pronounced volatility.

Typical behaviors observed:

* Inversion during an uptrend → prone to reversal lower or transition into a choppy range.
* Inversion during a downtrend → prone to reversal higher or transition into a consolidation range.

The yellow boxes mark inverted regimes where short-dated ATM IV spikes—often reflecting a jump in hedging demand—after which price frequently shows a clear directional change. When the inversion fades and the structure normalizes (1M ATM IV falls back below 3M/6M), realized volatility tends to decline and price action often compresses/mean-reverts.

### Conclusion: Limits of VTS

The volatility term structure is effective for tracking changes in volatility expectations, but it is not directional. An inversion indicates the market expects more near-term movement; it does not say whether price will rise or fall. In practice, traders pair VTS with other tools—e.g., sentiment gauges, liquidity metrics, or options skew—to cross-validate signals before acting.

{% hint style="info" %}

#### **Disclaimer**

Thank you for using CoinKarma. The data provided is based on historical performance and cannot guarantee future market trends. The cryptocurrency market is highly volatile. Users must assess risks and bear responsibility for their decisions.
{% endhint %}


# Short filter

## What is Short filter

When the Market Pulse Index triggers a short signal and the Cumberland USDT Distribution’s 7-day cumulative USDT transfer volume exceeds 10% of overall liquidity (USD), the “No-Short Filter” is triggered.

## How to use Short filter

The Short Filter (i.e., the “No-Short Filter”) is designed to keep you from shorting into a one-sided uptrend (the ❌ marks on the chart). While it may cause you to miss some short-side profits, it helps you avoid getting squeezed by shorting too early—such as at points A and B. In many cases, once the “No-Short Filter” fires, more attractive short setups tend to appear later (see the orange arrows).

<figure><img src="/files/qUs8eLqWlMtz8evqpE32" alt=""><figcaption></figcaption></figure>

{% hint style="info" %}

#### **Disclaimer**

Thank you for using CoinKarma. The data provided is based on historical performance and cannot guarantee future market trends. The cryptocurrency market is highly volatile. Users must assess risks and bear responsibility for their decisions.
{% endhint %}


# USDC/USDT Premium

## What is USDC/USDT Premium

USDC/USDT Premium measures the price spread between USDC and USDT. Although both are marketed as being pegged to USD at 1:1, in real trading their prices can trade at a premium or discount due to differences in demand and funding pressure. That spread can be used to infer short-term capital flows and where market pressure is coming from—and it tends to be highly correlated with BTC’s short-term price swings.

When there is no meaningful inflow of fresh external capital, the market is largely driven by internal capital rotation. Since USDT is the dominant settlement currency in crypto, its trading volume and depth have long exceeded those of USDC. As a result, BTC/USDT—rather than BTC/USDC—typically acts as the true benchmark for short-term price direction.

So when major players have an incentive to sell BTC in the short run, they usually start in the more liquid BTC/USDT market. This can lead to BTC/USDT trading below BTC/USDC, because BTC/USDT bears the brunt of the active selling pressure (and the opposite happens when they’re buying). Once that gap opens, an arbitrage opportunity emerges: arbitrageurs buy BTC where it’s cheaper (BTC/USDT), sell it where it’s more expensive (BTC/USDC), then sell the USDC they receive back into USDT to complete the loop. Therefore, when USDC/USDT Premium falls below 0, it often indicates that the dominant flow driving the market is net selling BTC.

Putting the logic together—using USDC/USDT Premium < 0 as an example:

1. Large capital sells BTC on BTC/USDT → BTC/USDT leads the decline
2. This creates BTC/USDT < BTC/USDC → arbitrage opportunities appear
3. Arbitrage flows step in: buy BTC on cheaper BTC/USDT, sell BTC on richer BTC/USDC
4. Arbitrageurs then sell the USDC proceeds back into USDT → pushing USDC/USDT Premium below 0

## How to use USDC/USDT Premium

Using USDC/USDT Premium < 0 as an example: in an environment with no incremental external capital, whenever the USDC/USDT Premium turns negative, the market often shows short-term topping behavior soon after.

<figure><img src="/files/PAMLoDZfcgbQuKfwil2N" alt=""><figcaption></figcaption></figure>

{% hint style="info" %}

#### **Disclaimer**

Thank you for using CoinKarma. The data provided is based on historical performance and cannot guarantee future market trends. The cryptocurrency market is highly volatile. Users must assess risks and bear responsibility for their decisions.
{% endhint %}


# Custom Signal

#### What is a Custom Signal?

As shown in the chart, **Custom Signal** allows you to define specific conditions for displaying arrows directly on the chart.

<figure><img src="/files/GOnliBgL00xFkAzMVx1Z" alt=""><figcaption></figcaption></figure>

***

#### How to Set Up a Custom Signal

1. Navigate to **CoinKarma** and select the **Custom Signal** indicator.
2. Click on the gear icon to customize the conditions for displaying arrows.

<figure><img src="/files/uMshwgCNDIcKClmgO7vo" alt=""><figcaption></figcaption></figure>


# Custom Alerts

## What is Custom Alerts?

**Custom Alerts** allow users to set notifications triggered when an indicator reaches a predefined threshold. The system will send real-time alerts to a connected Telegram bot, enabling users to monitor indicator activity conveniently.

<figure><img src="/files/7mfiMP3kkELtZY3DdSgJ" alt=""><figcaption></figcaption></figure>

***

## How to Set Up Custom Alerts

1. **Link Your Telegram Account:**\
   Begin by completing the integration of your Telegram account.

<figure><img src="/files/suWQbtJVY0UmW0XpCVMX" alt=""><figcaption></figcaption></figure>

2. **Define Alert Conditions:**\
   Once your Telegram account is linked, go to the settings and add custom conditions for triggering alerts.

<figure><img src="/files/6ydhPHWARupGU2KuL45k" alt=""><figcaption></figcaption></figure>


# Token Screener

## What is Token Screener?

Token Screener is an exclusive channel for members that provides hourly updates.

<figure><img src="/files/wUbsBuIpRKq4VhIsn4Y4" alt=""><figcaption></figcaption></figure>

This channel categorizes all cryptocurrencies into four quadrants and uses color to indicate whether certain conditions are met. Coins that do not meet the criteria are shown in white, while BTC is always marked in orange on the quadrant chart.

<figure><img src="/files/zHFr12IwELjzxtcLggps" alt=""><figcaption></figcaption></figure>

Note 1: RSI\_Dif = the value obtained by subtracting BTC’s RSI from the coin’s RSI. A positive value indicates stronger relative strength; a negative value indicates weaker.

Note 2: LIQ Percentile = the percentile rank of the coin’s LIQ over the past month.

### How to Use Token Screener <a href="#ru-he-yun-yong-token-screener" id="ru-he-yun-yong-token-screener"></a>

Token Screener allows you to quickly identify strong tokens (Quadrant I) and weak tokens (Quadrant III). However, it’s essential not to rely solely on individual token data — you must also consider the overall market condition, primarily indicated by Bitcoin (referred to as BTC below).

In the crypto market, the price movements of altcoins remain highly correlated with BTC. Even if a specific altcoin shows strong individual metrics, if BTC is trending downward or broader market indicators are bearish, that altcoin will likely face headwinds and struggle to perform. This is mainly because many altcoins are traded against BTC (e.g., ALTs/BTC). So, even if an altcoin holds steady in USD terms, it can still perform poorly in BTC terms when BTC drops.

Therefore, when analyzing altcoins, it’s not enough to assess their standalone data — you must also evaluate BTC’s overall condition.

### How to Use It in Practice <a href="#ju-ti-cao-zuo" id="ju-ti-cao-zuo"></a>

1. Use Token Screener to quickly identify strong and weak tokens.
2. Observe BTC’s position on the Y-axis in the Token Screener chart:
   * The higher BTC appears on the Y-axis, the stronger the bullish tokens on the chart tend to be.
   * The lower BTC appears on the Y-axis, the stronger the bearish tokens on the chart tend to be.

● Case Studies: Identifying Strong and Weak Tokens

* Strong Token (April 7, 2025 – 15:00) – $SUI

$SUI appeared in the strong token list on Token Screener. Custom Signal data indicated supportive market liquidity (green arrow). Following this signal, $SUI experienced an impressive rally, significantly outperforming $BTC.

<figure><img src="/files/nOGCuIVy9yY3miiWYpkr" alt=""><figcaption></figcaption></figure>

* Strong Token (April 7, 2025 – 15:00) – $DOGE

$DOGE also showed up in the strong token list, with Custom Signal confirming favorable liquidity conditions (green arrow). It subsequently posted a major price surge, far outpacing $BTC.

<figure><img src="/files/bAxjrKYzuzHYVtOeJSpD" alt=""><figcaption></figcaption></figure>

* Weak Token (March 3, 2025 – 02:00) – $SOL

$SOL was flagged as a weak token by Token Screener. Custom Signal showed negative market liquidity conditions (red arrow), and $SOL later underwent a sharp correction, dropping more than $BTC.

<figure><img src="https://docs.coinkarma.co/~gitbook/image?url=https%3A%2F%2F1729336661-files.gitbook.io%2F%7E%2Ffiles%2Fv0%2Fb%2Fgitbook-x-prod.appspot.com%2Fo%2Fspaces%252FJw2jrjZQmACHsCUyfYLT%252Fuploads%252FGtlj1AaJdldSVkPH2dHZ%252Fimage.png%3Falt%3Dmedia%26token%3D6039f24e-7dec-4e5a-9492-377bde07d5a8&#x26;width=768&#x26;dpr=4&#x26;quality=100&#x26;sign=859c7c2&#x26;sv=2" alt=""><figcaption></figcaption></figure>

* Weak Token (March 3, 2025 – 02:00) – $LTC

$LTC appeared in the weak token list, with Custom Signal indicating bearish liquidity (red arrow). It later saw a significant decline, underperforming $BTC.

<figure><img src="/files/ISZ6ZTVphJRdULdhqRIp" alt=""><figcaption></figcaption></figure>

{% hint style="info" %}

#### **Disclaimer**

Thank you for using CoinKarma. The data provided is based on historical performance and cannot guarantee future market trends. The cryptocurrency market is highly volatile. Users must assess risks and bear responsibility for their decisions.
{% endhint %}


# Strategy Builder

## What is Strategy Builder?

**Strategy Builder** is a backtesting tool offered by CoinKarma. Users can customize various parameters to test their strategies. In the future, these user-defined strategies will be deployable for automated trading on the OKX platform (this feature is still under development; currently, only the backtesting tool is available).

<figure><img src="/files/cdqNEiPFKlnpiV0ZcWvg" alt=""><figcaption></figcaption></figure>

***

## How to Set Up Strategy Builder

1. Navigate to the **Strategy Editor** and create a backtest.

<figure><img src="/files/CL3OJjjxAGtuC8fGYjDr" alt=""><figcaption></figcaption></figure>

2. After running the backtest, the tool will provide relevant performance data for user reference.

<figure><img src="/files/aA8syUA7q8J3XxnaA10Y" alt=""><figcaption></figcaption></figure>

***

> **Note:**\
> Running a backtest will consume backtesting credits.


# Strategy Builder(Backtest & Trading Bot)

**Table of Contents**

* Feature Overview
* How to Create a Strategy
* How to Run a Backtest
* How to Create a Trading Bot
* FAQ

### I. Feature Overview: What is the Strategy Builder?

The **Strategy Builder** is a core feature of CoinKarma. It assists users in utilizing CoinKarma indicators to construct trading strategies, verify historical performance through backtesting, and deploy them as automated **trading bots** with a single click.

It consists of three core concepts:

* **Strategy:** The core of your trading logic. It defines the rules for when to enter (open a position) and exit (close a position) the market.
* **Backtest:** The verification mechanism for your strategy. It uses historical data to simulate strategy performance, providing key analytical data such as Return on Investment (ROI) and Maximum Drawdown (MDD).
* **Trading Bot:** The practical application of your strategy. Connects your validated strategy to the OKX exchange to achieve fully automated trading.

### II. How to Create a Strategy

There are two ways to create a strategy:

#### Method 1: Custom Strategy

Suitable for users with clear trading ideas.

1. Click the **"+ Create strategy"** button on the page.
2. Enter your entry/exit logic and indicator parameters in the editor.
3. Once confirmed, click **"Submit"**. You can then view the strategy in **"My strategy"**.

<figure><img src="/files/S7mqdJjcJVqBo3sFVHVp" alt=""><figcaption></figcaption></figure>

<figure><img src="/files/NZNsu7oyTvE5aSq9nYhX" alt=""><figcaption></figcaption></figure>

<figure><img src="/files/jUFrb2ee0Iqz5DnFXzsa" alt=""><figcaption></figcaption></figure>

#### Method 2: Recommended Strategy

Suitable for beginners or users who want to reference official logic.

1. Switch to the **"Recommended"** tab.
2. Browse the list of officially selected strategies.
3. Select a strategy you are interested in and click **"Add to my strategy"**.
4. The system will automatically copy the strategy to your personal library, where you can use it directly or modify it.

<figure><img src="/files/7KvLovTA6VhmpQaGHIut" alt=""><figcaption></figcaption></figure>

<figure><img src="/files/XA2CfcvRKDTlKqCVtrJv" alt=""><figcaption></figcaption></figure>

### III. How to Run a Backtest

Before investing real funds, it is strongly recommended to perform a historical **backtest**.

1. Click **"Run backtest"** on the strategy page.
2. Set the backtest parameters in the pop-up window:
   * **Time Start/End:** Select the historical range you want to verify.
   * **Leverage:** Set the leverage multiplier for the simulated trading.
3. Click Submit. The system will begin calculations. Depending on the amount of data, this usually takes 1-5 minutes.
4. Once the calculation is complete, you will see a detailed performance analysis report.

<figure><img src="/files/s4hyQBoNcnI94GXa3Ixb" alt=""><figcaption></figcaption></figure>

<figure><img src="/files/tdjfCiFA8xnCDB7YEI2h" alt=""><figcaption></figcaption></figure>

<figure><img src="/files/uo1D5qMTf6juONqClq4a" alt=""><figcaption></figcaption></figure>

<figure><img src="/files/hGovnV7a92ZTdpHLaPoM" alt=""><figcaption></figcaption></figure>

### IV. How to Create a Trading Bot

Once you are satisfied with a strategy's **backtest** performance, you can deploy it to OKX for automated trading.

#### **Step 1: Bind OKX Account**

1. Click the **"Create bot"** button.
2. The system will guide you to bind your OKX API (if not yet bound).
   * *Security Statement:* This OKX API permission is **"Read-Only"** and cannot perform any fund transfers.
   * *Note:* If you have previously failed to bind, please ensure you go to the OKX API management page to delete the old API Key before restarting the binding process.

<figure><img src="/files/s4hyQBoNcnI94GXa3Ixb" alt=""><figcaption></figcaption></figure>

<figure><img src="/files/wtiWF8BxK92fOpH6oW0p" alt=""><figcaption></figcaption></figure>

<figure><img src="/files/W7ZGheLtMCWYpXzNLWT4" alt=""><figcaption></figcaption></figure>

#### **Step 2: Submit for Review and Activate**

1. After binding is complete, check the agreement box in the confirmation window and click **"Submit"**.
2. The bot status will show as **Pending** (Under Review). Please wait for the OKX system to review it (usually completed within 24 hours).
3. Once approved, the status will update to **Active**.

<figure><img src="/files/uGrBnRRywp2IDEWx7nlg" alt=""><figcaption></figcaption></figure>

<figure><img src="/files/9YfEIa3pbk9qX2hDd1kK" alt=""><figcaption></figcaption></figure>

<figure><img src="/files/6YGdhmKmRthsVgz6wnZF" alt=""><figcaption></figcaption></figure>

#### **Step 3: Invest Funds and Start Trading**

1. Click the **"Invest funds into OKX"** button. The system will redirect you to the OKX signal subscription page.
2. Confirm the subscription on the OKX page and set the margin amount and leverage you wish to invest.
3. Once setup is complete, the **trading bot** will officially start. CoinKarma will automatically send trading signals based on your strategy logic, and OKX will execute the orders.

<figure><img src="/files/SCQ8y3j6quJmveHkkT0f" alt=""><figcaption></figcaption></figure>

<figure><img src="/files/r4P2Tww5nkhaSVwoG8OS" alt=""><figcaption></figcaption></figure>

<figure><img src="/files/7TH7iOQwkIEf7GkiLr5S" alt=""><figcaption></figcaption></figure>

<figure><img src="/files/KbPcnk30uN9N3CCtMpMA" alt=""><figcaption></figcaption></figure>

### V. FAQ

#### Q1: How do I set Take Profit (TP) and Stop Loss (SL) for the trading bot?

TP and SL must be operated directly on the OKX exchange interface.

Operation Path: Go to the OKX Positions/Trade page → Select Signal Bot → Click "Details" on the bot you want to configure → Find the "Take profit" or "Stop loss" options to set the values.

Note: OKX signal bots use "Percentage of Price" for TP/SL calculations. This means the system triggers a close when the price reaches a set percentage increase or decrease relative to the entry price.

<figure><img src="/files/04qpFHWQb78lj3SH8e6L" alt=""><figcaption></figcaption></figure>

<figure><img src="/files/R9Zj8u5SPMXGSGSz9g0e" alt=""><figcaption></figcaption></figure>

#### Q2: How do I set the Leverage for the trading bot?

Leverage must be set during the Invest Funds (Margin) stage of the bot.

Instructions: On the page where you invest Margin, there will be an option to adjust the leverage multiplier. Please ensure the leverage matches your risk tolerance before submitting the bot.

<figure><img src="/files/7TH7iOQwkIEf7GkiLr5S" alt=""><figcaption></figcaption></figure>

#### Q3: How long does the review take after creating and submitting a bot?

After you submit a bot strategy, OKX officials usually complete the review process within 24 hours. Once approved, the bot can begin receiving signals and operating.

Q4: Is the trading bot's entry position size calculated based on "Initial Capital" or "Current Balance"?

The bot's entry signals use a Percentage of Balance (Dynamic) mode.

* **Calculation:** The system calculates the order amount based on your current "Available Balance."
* **Compounding Effect:** This means the entry amount is not locked to the "Initial Capital" but includes "Initial Capital + Realized PnL." If the strategy makes a profit, subsequent order amounts will increase correspondingly (compounding); conversely, they will decrease if there is a loss.

#### Q5: Will the trading bot use my API Key to trade?

No, please rest assured.

* **Trade Execution:** Our bots use **Webhook** technology to send trading signals to OKX. We do not control your account to place orders directly via API.
* **Permissions:** If the platform requires you to provide an API Key, that Key only has **"Read-Only"** permissions. It is used solely for syncing data and displaying performance; it cannot misappropriate funds or execute trades.

<figure><img src="/files/wtiWF8BxK92fOpH6oW0p" alt=""><figcaption></figcaption></figure>

#### Q6: Which countries or regions cannot use the trading bot service?

This service follows OKX exchange compliance policies. Due to local legal restrictions, some regions may not be able to use related services (especially derivatives trading).

According to OKX's latest risk disclosure statement, restricted jurisdictions include but are not limited to:

* **North America:** United States (including all territories), Canada.
* **Asia-Pacific:** Hong Kong, Japan, Malaysia, Singapore (Spot only, derivatives not supported), South Korea (restricted derivative services), Bangladesh, India, Nepal, North Korea.
* Other Regions: United Kingdom (restricted derivatives), Iran, Russia, Cuba, Syria, specific regions of Ukraine (Crimea, etc.), Algeria, Bolivia, etc.

  Note: The list of compliant regions may change with OKX policy updates. Please refer to the OKX Official Terms of Service for the most detailed and up-to-date information.

#### Q7: What is the profit-sharing ratio for the trading bot?

The platform adopts a 10% Performance Fee mechanism.

CoinKarma only charges 10% of the profit as a fee when the trading bot generates actual profit for you; if there is no profit, no fee is charged.

#### Q8: Why is the "Maximum Drawdown (MDD)" amount different from the "Actual Realized Loss"?

This is because the calculation basis is different. "Realized Loss" only records the result after closing the position (exit point), whereas "Maximum Drawdown" calculates the maximum floating loss experienced during the holding period (the lowest point during the process).

Example:

Suppose you open a long position when BTC is at $100,000.

1. The price drops to $80,000 during the session (at this point, the floating loss is -20%, which is recorded as the Maximum Drawdown).
2. The price subsequently rebounds, and you finally stop loss and close at $95,000 (actual realized loss is -5%).

   In this case, your actual loss is only 5%, but the strategy's MDD will show 20%. This more truthfully reflects the risk the strategy might face under extreme market conditions.

#### Q9: Can I modify parameters and re-run a backtest for a strategy that has already been tested?

Yes. Click "Edit strategy" to edit the strategy parameters, and then click "Rerun backtest" to run the test again with the modified parameters.

#### Q10: Can I modify strategy parameters for a trading bot currently running on OKX, and will it take effect immediately?

Yes. The modification method is the same as for backtesting. Please click "Edit strategy", modify the parameters, and save.

After a successful update, the new strategy will take effect immediately. CoinKarma will instantly use the new logic to send trading signals. You do not need to stop the bot or redeploy it.


# Grid Trading Signal

## What is Grid Trading Signal

Grid Trading Signal is an exclusive “grid copy trading” channel for Gold members.

<figure><img src="/files/TkQEMXjKIidgS76jRESG" alt=""><figcaption></figcaption></figure>

#### Copy Trading Information

• Trading Pair: BTC

• Trading Direction: Both long and short

• Entry Strategy: Orders are placed in batches for each grid based on entry conditions

• Profit Sharing: 10%

#### Entry Conditions

• Long Position: When Overall LIQ > 2 and notional\_btc ≥ 3000

• Short Position: When Overall LIQ < -2 and notional\_btc ≤ -3000

#### Exit Conditions

• For Grid Long Positions: Automatically closed when Overall LIQ < -1

• For Grid Short Positions: Automatically closed when Overall LIQ > 1

#### Take Profit & Stop Loss Conditions

• Take Profit: Order closes when PnL per grid ≥ 30%

• Stop Loss: Order closes when PnL per grid ≤ -30%

(The order will be closed when either the exit condition or the take profit/stop loss condition is met.)


# Market Pulse

## What is Market Pulse

Market Pulse is an index ranging from 0 to 100, calculated based on 11 indicators from CoinKarma.

<figure><img src="/files/YjaEKLRB7L2Rk9FvROKr" alt=""><figcaption></figcaption></figure>

## How to use Market Pulse

#### Pulse Index&#x20;

* Pulse Index ≤ 20：Potential buying opportunity for a market reversal&#x20;
* Pulse Index  ≥ 80：Potential selling opportunity for a market reversal

<figure><img src="https://lh7-rt.googleusercontent.com/docsz/AD_4nXdWyayIkm3_S7ne0pj_S6AWNiIzdtJA43zZHWJU8LvHkIZEO-RKtYuRHnRmIyop2dP6vCtFtiUbJxvCqbVhipCmwVzDRSDB-QE3No-hDxpXM246KtQpxo-TwbfWECWWNmaeL0fOIA?key=luLiz2GY4XjFT_nYY-mTIQJp" alt=""><figcaption><p>Users Can Review Market Pulse via CoinKarma Charts</p></figcaption></figure>

#### Individual Market Pulse Indicators

🟢 Potential buying opportunity for a market reversal

⚪ Neutral (wait-and-see approach)

🟠 Caution – be aware of downside risks

🔴 Potential selling-to-buying transition<br>

<figure><img src="https://lh7-rt.googleusercontent.com/docsz/AD_4nXdPmp4VsDPgkB_fOPdz6AkbPijV3thO588pE6dUWpVf0dfH92n2uUoYw5pqh_FAVHFjWwa1VV8Hqsqiv7Aa2m56ixeI7_Safkz3Q8P4ISE_4Kq9HsXTDNAPSi53_sVLG2G5A3uQ?key=luLiz2GY4XjFT_nYY-mTIQJp" alt=""><figcaption><p>註:圖中 Current Value 的箭頭增減是與上一小時 Value 比較的結果</p></figcaption></figure>

#### Comparison: Market Pulse Channel vs. Overall Liquidity Channel

<figure><img src="/files/6P1ia8dJBpd06EGeW4yk" alt=""><figcaption></figcaption></figure>

{% hint style="info" %}

#### **Disclaimer**

Thank you for using CoinKarma. The data provided is based on historical performance and cannot guarantee future market trends. The cryptocurrency market is highly volatile. Users must assess risks and bear responsibility for their decisions.
{% endhint %}


# Ultron Signal

### What is Ultron Signal? <a href="#shen-mo-shi-ultron-signal" id="shen-mo-shi-ultron-signal"></a>

Ultron Signal is an exclusive copy trading strategy available to Gold members.

<figure><img src="/files/W58HKXbw4wLnf33JVQIt" alt=""><figcaption></figcaption></figure>

## How to Subscribe to Ultron Signal&#x20;

Ultron Signal currently offers two copy trading solutions:

1. OKX Signal Trading Edition
2. Hyperliquid Vault Edition

<figure><img src="/files/s7dKWizgJmaEpGUESrCR" alt=""><figcaption></figcaption></figure>

<table data-header-hidden data-full-width="true"><thead><tr><th width="86.4088134765625"></th><th width="331.3802490234375"></th><th></th></tr></thead><tbody><tr><td></td><td>OKX Signal Trading Edition</td><td>Hyperliquid Vault Edition</td></tr><tr><td>Steps</td><td><p></p><ul><li>Go to the <a href="https://www.coinkarma.co/zh-tw/ultron-signal">Ultron Signal link</a> → Subscribe Now → Select OKX.</li><li>OKX - [Coinkarma] Ultron signal → Click Use.</li><li>Enter your investment margin → Click Create Strategy.</li></ul></td><td><ul><li>Go to the <a href="https://www.coinkarma.co/zh-tw/ultron-signal">Ultron Signal link</a> → Subscribe Now → Select Hyperliquid.</li><li>Click "Deposit / Follow" and enter the amount of USDC to invest.</li></ul><p>Prerequisites:</p><ul><li>If you don’t have a Hyperliquid account, use the referral link to register and get a 4% fee discount: <a href="https://app.hyperliquid.xyz/join/COINKARMA">Hyperliquid Registration Link</a></li><li>Prepare USDC and a small amount of ETH (for gas) in your Arbitrum wallet.</li><li>After logging in, go to the Portfolio page, select Deposit, and transfer USDC to Hyperliquid L2.<br></li></ul></td></tr></tbody></table>

### Signal Details <a href="#gen-dan-zi-xun" id="gen-dan-zi-xun"></a>

<table data-header-hidden><thead><tr><th width="143.54852294921875"></th><th></th><th></th></tr></thead><tbody><tr><td></td><td>OKX Signal Trading Edition</td><td>Hyperliquid Vault Edition</td></tr><tr><td>Trading Pair</td><td>$BTC</td><td>$BTC</td></tr><tr><td>Direction</td><td>Long &#x26; Short</td><td>Long &#x26; Short</td></tr><tr><td>Leverage</td><td>Default 3x.  Adjustable based on risk preference. If adjusting above 3x, it is recommended to manually configure "Take Profit / Stop Loss" in "Advanced Settings" before copying.</td><td>Fixed leverage; TP/SL conditions cannot be manually adjusted.</td></tr><tr><td>Min. Investment</td><td>$1,000 USDT (Post-leverage)</td><td>$100 USDC (Post-leverage)</td></tr><tr><td>Profit Share</td><td>10%</td><td>10%</td></tr></tbody></table>

### Strategy Overview

**Core Framework**\
Ultron Signal is powered by the proprietary **Market Pulse Index (MPI)**, which serves as the core indicator for assessing market strength, determining entry and exit points, and dynamically adjusting position size.

**Multi-Layer Dynamic Adjustment**\
The strategy integrates multiple market factors, including:

* Long-term moving averages (trend direction)
* RSI (market momentum)
* Recent realized volatility (market activity)

These elements collectively influence the system’s threshold levels, allowing Ultron Signal to automatically adapt to changing market structures.

**No-Short Filter**\
When buy-side strength significantly outweighs sell pressure, the system activates a **“No-Short” protection mode**, temporarily disabling short positions to reduce counter-trend risks and enhance decision flexibility.

## Stop-Loss Mechanism&#x20;

Ultron Signal does not employ a fixed stop-loss level.

The main reason is that each user applies different leverage, and a uniform stop-loss threshold could lead to delayed liquidation for high-leverage users or premature exits for low-leverage users. Instead, the strategy incorporates a **dynamic risk control framework**.

For example, when the strategy holds a long position and the market experiences an **overextended decline** while the **MPI starts to flatten out**, Ultron will automatically scale down or close positions *as the market rebounds*, creating a natural stop-loss effect.

Using **3× leverage** as an example: even during sharp drawdowns such as in **April 2025**, the **maximum drawdown (MDD)** was limited to around **20%**, keeping the risk within a controllable range. Therefore, we recommend operating the strategy with **leverage up to 3×**.

For users employing higher leverage, additional **take-profit and stop-loss conditions** can be customized within the **Advanced Settings** panel when subscribing to the OKX signal.


# OKX Referral Reassignment

Want to enjoy subscription discounts and trading rewards? Just follow a few simple steps to check whether your account is eligible for referral reassignment and complete the link!

## How to Reassign Your Referral Link <a href="#f3aab62b-c6c2-4600-840c-e5787c2ca6bb" id="f3aab62b-c6c2-4600-840c-e5787c2ca6bb"></a>

1. Click the official referral reassignment link: <https://www.okx.com/ul/J6l2R5>

2. Enter the referral code manuall&#x79;**：** <mark style="color:$info;">`coinkarma`</mark>

   * If an error page appears, it means your account is currently not eligible for referral reassignment (see details below).

   <figure><img src="/files/SHB6fvC7BPFBWyF5VnNS" alt=""><figcaption></figcaption></figure>

3. Wait for Approva&#x6C;**：** After you submit successfully, the review typically takes about 1 business day. Once you receive an official notification from OKX, your account has been successfully linked.

<figure><img src="/files/BG5OJnYSumpiujbV77WN" alt=""><figcaption></figcaption></figure>

***

### Eligibility Restrictions

f you’re unable to link your account, it’s usually due to one of the following reasons:

* Active trading account: The account has a history of frequent/high-volume trading activity.
* Existing referral history: The account has previously invited others using a referral code.

***

### Exclusive Benefits of Linking with CoinKarma

After linking successfully, you’ll receive two key benefits:

* **Subscription discount:** 10% off all CoinKarma subscription plans.

  <figure><img src="/files/XHRSVxFKxKzrfdVSQwnW" alt=""><figcaption></figcaption></figure>
* **Trade volume to points**: Your trade volume is automatically converted into points, which can be used to extend your subscription period.

***

If you have any questions about the reassignment process, feel free to message support:\
&#x20; 👉 <https://t.me/CoinKarma_Roman>