> For the complete documentation index, see [llms.txt](https://docs.coinkarma.co/llms.txt). Markdown versions of documentation pages are available by appending `.md` to page URLs; this page is available as [Markdown](https://docs.coinkarma.co/english/features-guide/token-screener.md).
# Token Screener (Altcoin Screener)
## What is Token Screener (Altcoin Screener)?
Token Screener is an exclusive channel for members that provides hourly updates.
This channel categorizes all coins into four quadrants and uses color to indicate whether certain conditions are met. Coins that do not meet the criteria are shown in white, while BTC is always marked in orange on the quadrant chart.
Note 1: RSI\_Dif = the coin's RSI minus BTC's RSI. A positive value means stronger; a negative value means weaker.
Note 2: LIQ Percentile = the percentile rank of the coin's LIQ over the past month.
## How to Use Token Screener
Token Screener lets you quickly identify strong tokens (Quadrant I) and weak tokens (Quadrant III).
But even after you identify strong (or weak) tokens, you still need to check whether the overall market (that is, Bitcoin, referred to as BTC below) supports the move. In crypto, the price movements of altcoins remain highly correlated with BTC. Even if a specific altcoin shows strong data on its own, if BTC is weakening or broader market data is bearish, that altcoin will usually be held back and struggle to rise on its own. This is mainly because many altcoins are traded against BTC (ALTs/BTC). So even if an altcoin holds steady in USD terms, ALTs/BTC can still perform poorly when BTC drops.
\
Therefore, when analyzing altcoins, it's not enough to look at their standalone data; you must also consider BTC's overall data.
## How to Use It in Practice
1. Use Token Screener to quickly identify strong and weak tokens.
2. Observe where BTC sits on the Y-axis in the Token Screener chart:
* The higher BTC sits on the Y-axis, the stronger the signal from the strong tokens on the chart.
* The lower BTC sits on the Y-axis, the stronger the signal from the weak tokens on the chart.
● Case Studies: Identifying Strong and Weak Tokens
* Strong Token (2025/04/07 15:00): $SUI
$SUI appeared in the strong token list on Token Screener, and Custom Signal showed that overall market liquidity data supported it (green arrow). $SUI then posted an impressive rally, significantly outperforming $BTC.
* Strong Token (2025/04/07 15:00): $DOGE
$DOGE appeared in the strong token list on Token Screener, and Custom Signal showed that overall market liquidity data supported it (green arrow). $DOGE then posted an impressive rally, significantly outperforming $BTC.
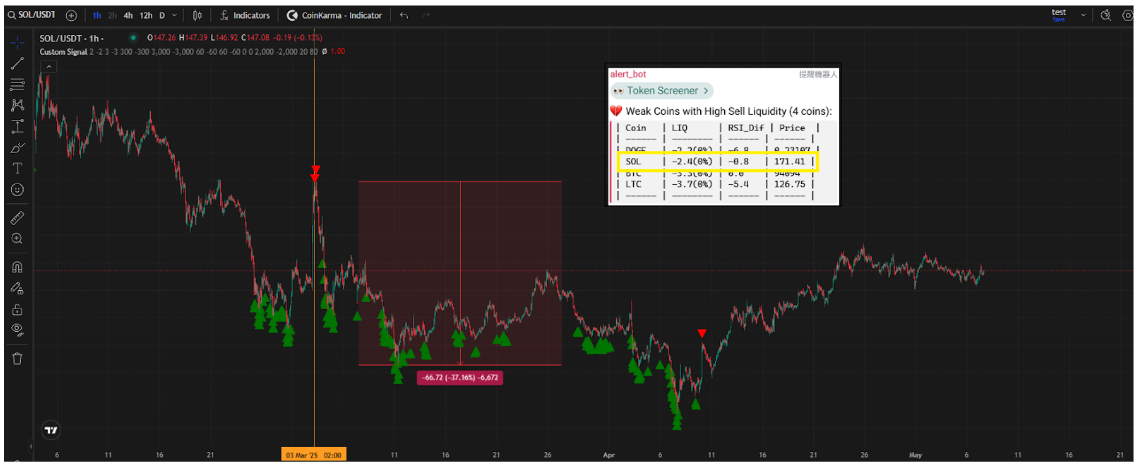
* Weak Token (2025/03/03 02:00): $SOL
$SOL appeared in the weak token list on Token Screener, and Custom Signal showed that overall market liquidity data supported it (red arrow). $SOL then went through a sharp correction, falling more than $BTC.
* Weak Token (2025/03/03 02:00): $LTC
$LTC appeared in the weak token list on Token Screener, and Custom Signal showed that overall market liquidity data supported it (red arrow). $LTC then went through a sharp correction, falling more than $BTC.
{% hint style="info" %}
#### **Disclaimer**
Thank you for using CoinKarma. The data provided is based on historical performance and cannot guarantee future market trends. The cryptocurrency market is highly volatile. Users must assess risks and bear responsibility for their decisions.
{% endhint %}